深度学习实践第二讲之线性模型
线性模型 Linear Model
B站 刘二大人 PyTorch深度学习实践-线性模型
线性模型试图学得一个通过属性的线性组合来进行预测的函数,即:
f ( x ) = W T x + b f(x) = W^Tx+b f(x)=WTx+b
我们的目标是让输出 f ( x ) f(x) f(x)和真实值 y y y相比尽可能的小,采用均方误差(Mean Square Error, MSE)作为loss函数,即:
M S E = 1 N ∑ i = 1 N ( f ( x i ) − y i ) 2 MSE = \frac{1}{N}\sum_{i=1}^{N}{(f(x_i)-y_i)^2} MSE=N1i=1∑N(f(xi)−yi)2
拟合目标
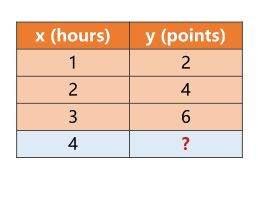
本节课的拟合目标是拟合如下数据:
import numpy as np
import matplotlib.pyplot as plt

# dataSet
x_data = [1.0, 2.0, 3.0]
y_data = [2.0, 4.0, 6.0]

# define forawrd function
def forward(x):
    return x * w

# define loss function
def loss(x, y):
    y_pred = forward(x)
    return (y_pred - y) ** 2

w_list = []
mse_list = []

# target parameter
target = {
     'loss':float('inf'), 'w':0}

# training
for w in np.arange(0.0, 4.1, 0.01):
    print('w=', w)
    l_sum = 0
    for x_val, y_val in zip(x_data, y_data):
        y_pred_val = forward(x_val)
        loss_val = loss(x_val, y_val)
        l_sum += loss_val
        print('\t',x_val, y_val, y_pred_val, loss_val)
    print('MSE=', l_sum/3)
    w_list.append(w)
    mse_list.append(l_sum/3)
    if l_sum < target['loss']:
        target['loss'] = l_sum/3
        target['w'] = w
print('*'*100)
print('target linear model is : y = x * {} , MSE = {}'.format(target['w'], target['loss']) )

# visualize
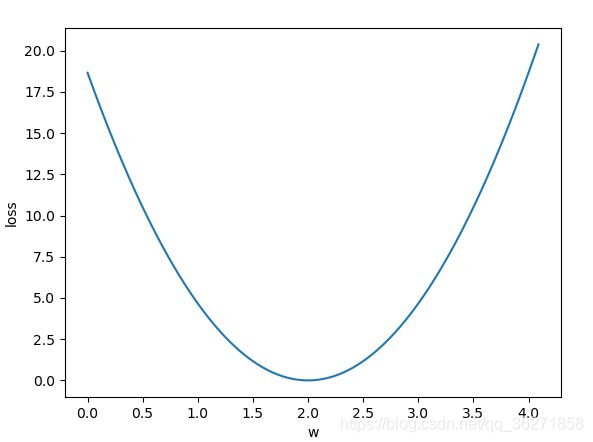
plt.plot(w_list, mse_list)
plt.xlabel('w')
plt.ylabel('loss')
plt.show()
结果

target linear model is : y = x * 2.0 , MSE = 0.0
课后作业
使用 y ^ = x ∗ w + b \hat{y}=x * w +b y^=x∗w+b拟合数据,并画出损失函数图
代码
import numpy as np
import matplotlib.pyplot as plt
from mpl_toolkits.mplot3d import Axes3D

# fake data, target model: y = 3x + 1
x_data = [1.0, 2.0, 3.0]
y_data = [4.0, 7.0, 10.0]

# define forward function
def forward(x):
    return w*x + b

# define loss function
def loss(y_pred, y):
    return (y_pred - y) ** 2

mse_list = []
W = np.arange(0,6.0,0.01)
B = np.arange(-2,4.0,0.01)

[w,b] = np.meshgrid(W,B)
target = {
     'w':0, 'b':0, 'loss': float('inf')}

loss_sum = np.zeros_like(w)
for x_val, y_val in zip(x_data, y_data):
    y_pred_val = forward(x_val)
    loss_val = loss(y_pred_val, y_val)
    loss_sum += loss_val

target = {
     'loss': float('inf'), 'w':0, 'b':0}
count = 0
for i in range(loss_sum.shape[0]):
    for j in range(loss_sum.shape[1]):
       if loss_sum[i][j] < target['loss']:
            target['loss'] = loss_sum[i][j]
            target['w'] = w[i][j]
            target['b'] = b[i][j]

print('target linear model is y = %.2f * x + %.2f' % (target['w'], target['b']))

# draw cost graph
fig = plt.figure()
ax = Axes3D(fig)
ax.plot_surface(w, b, loss_sum/3)
plt.xlabel('w')
plt.ylabel('b')
plt.show()
tips:forward中只需要传入 x x x的原因是使用np.meshgrid()方法,返回了形如(len(B),len(W))的矩阵,因为numpy可以进行broadcast,所以返回值也是一个形如(len(B),len(W))的numpy.ndarray,一次对传进来的样本计算了所有可能的w和b。
结果

target linear model is y = 3.00 * x + 1.00
B站 刘二大人 PyTorch深度学习实践-线性模型
