文章目录
- Matplotlib基础
-
- 默认配置
-
- `plot(color, linewidth, linestyle, marker)`
- 设置图片上下左右边界距离`xlim-ylim`
- 设置横纵坐标轴刻度`xticks-yticks`
- 添加图例`legend`
- 设置坐标轴标签`xticklabels-yticklabels`
- 设置标题`title`
- 添加文本`text`
- 子图`subplot`
- `plt`绘制图表汇总
- Matplotlib 绘图举例
-
- Matplotlib进阶
Matplotlib基础
默认配置
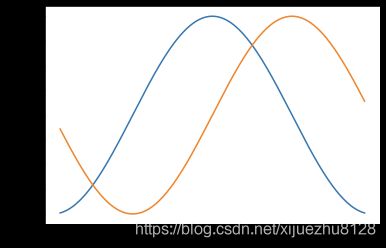
import numpy as np
import matplotlib.pyplot as plt

X = np.linspace(-3, 3, 256, endpoint=True)
C,S = np.cos(X), np.sin(X)

plt.plot(X,C)
plt.plot(X,S)

plt.show()
plot(color, linewidth, linestyle, marker)
color:
=============    ===============================
character        color
=============    ===============================
``'b'``          blue 蓝
``'g'``          green 绿
``'r'``          red 红
``'c'``          cyan 蓝绿
``'m'``          magenta 洋红
``'y'``          yellow 黄
``'k'``          black 黑
``'w'``          white 白
=============    ===============================
linestyle:
=============    ===============================
character        description
=============    ===============================
``'-'``          solid line style 实线
``'--'``         dashed line style 虚线
``'-.'``         dash-dot line style 点画线
``':'``          dotted line style 点线
=============    ===============================
marker:
=============    ===============================
character        description
=============    ===============================
``'.'``          point marker
``','``          pixel marker
``'o'``          circle marker
``'v'``          triangle_down marker
``'^'``          triangle_up marker
``'<'``          triangle_left marker
``'>'``          triangle_right marker
``'1'``          tri_down marker
``'2'``          tri_up marker
``'3'``          tri_left marker
``'4'``          tri_right marker
``'s'``          square marker
``'p'``          pentagon marker
``'*'``          star marker
``'h'``          hexagon1 marker
``'H'``          hexagon2 marker
``'+'``          plus marker
``'x'``          x marker
``'D'``          diamond marker
``'d'``          thin_diamond marker
``'|'``          vline marker
``'_'``          hline marker
=============    ===============================
import numpy as np
import matplotlib.pyplot as plt

X = np.linspace(-3, 3, 256, endpoint=True)
C,S = np.cos(X), np.sin(X)

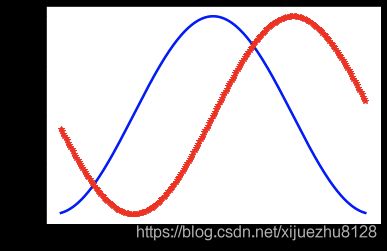
plt.plot(X, C, color="blue", linewidth=2.5, linestyle="-")
plt.plot(X, S, color="red",  linewidth=1, linestyle="--", marker='*')

plt.show()
设置图片上下左右边界距离xlim-ylim
import numpy as np
import matplotlib.pyplot as plt

X = np.linspace(-3, 3, 256, endpoint=True)
C,S = np.cos(X), np.sin(X)

plt.plot(X, C)
plt.plot(X, S)

plt.xlim(-4, 4)
plt.ylim(-1.5, 1.5)

plt.show()

设置横纵坐标轴刻度xticks-yticks
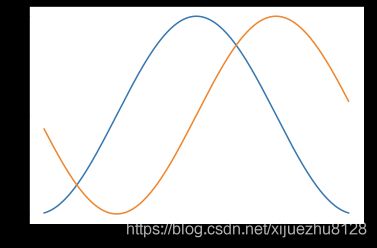
import numpy as np
import matplotlib.pyplot as plt

X = np.linspace(-3, 3, 256, endpoint=True)
C,S = np.cos(X), np.sin(X)

plt.plot(X, C)
plt.plot(X, S)

plt.xticks([-np.pi, -np.pi/2, 0, np.pi/2, np.pi])
plt.yticks([-1, 0, 1])

plt.show()
import numpy as np
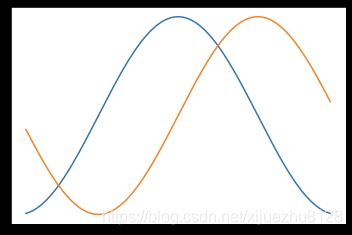
import matplotlib.pyplot as plt
X = np.linspace(-3, 3, 256, endpoint=True)
C,S = np.cos(X), np.sin(X)
plt.plot(X, C)
plt.plot(X, S)
plt.xticks([])
plt.yticks([])
plt.show()
添加图例legend
import numpy as np
import matplotlib.pyplot as plt

X = np.linspace(-3, 3, 256, endpoint=True)
C,S = np.cos(X), np.sin(X)

plt.plot(X, C, label='cosine')
plt.plot(X, S, label='sine')

plt.legend()

plt.show()

设置坐标轴标签xticklabels-yticklabels
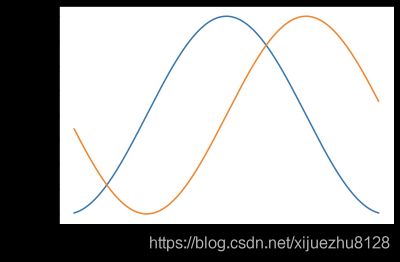
import numpy as np
import matplotlib.pyplot as plt

X = np.linspace(-3, 3, 256, endpoint=True)
C,S = np.cos(X), np.sin(X)

plt.plot(X, C, label='cosine')
plt.plot(X, S, label='sine')

plt.xlabel('x')
plt.ylabel('y')

plt.show()
设置标题title
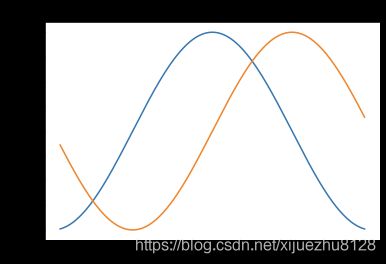
import numpy as np
import matplotlib.pyplot as plt

X = np.linspace(-3, 3, 256, endpoint=True)
C,S = np.cos(X), np.sin(X)

plt.plot(X, C, label='cosine')
plt.plot(X, S, label='sine')

plt.title('sin-cos')

plt.show()
添加文本text
import numpy as np
import matplotlib.pyplot as plt

X = np.linspace(-3, 3, 256, endpoint=True)
C,S = np.cos(X), np.sin(X)

plt.plot(X, C, label='cosine')
plt.plot(X, S, label='sine')

t = "This is a really long string!"
plt.text(0, 0, t, ha='left', rotation=15, wrap=True)
plt.text(2, 0, t, ha='left', rotation=15, wrap=True)

plt.show()

子图subplot
import numpy as np
import matplotlib.pyplot as plt
X = np.linspace(-3, 3, 256, endpoint=True)
C,S = np.cos(X), np.sin(X)
plt.subplot(211)
plt.plot(X, C)
plt.subplot(212)
plt.plot(X, S)
plt.show()

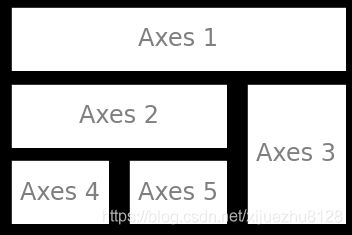
from pylab import *
import matplotlib.gridspec as gridspec
G = gridspec.GridSpec(3, 3)
axes_1 = subplot(G[0, :])
xticks([]), yticks([])
text(0.5,0.5, 'Axes 1',ha='center',va='center',size=24,alpha=.5)
axes_2 = subplot(G[1,:-1])
xticks([]), yticks([])
text(0.5,0.5, 'Axes 2',ha='center',va='center',size=24,alpha=.5)
axes_3 = subplot(G[1:, -1])
xticks([]), yticks([])
text(0.5,0.5, 'Axes 3',ha='center',va='center',size=24,alpha=.5)
axes_4 = subplot(G[-1,0])
xticks([]), yticks([])
text(0.5,0.5, 'Axes 4',ha='center',va='center',size=24,alpha=.5)
axes_5 = subplot(G[-1,-2])
xticks([]), yticks([])
text(0.5,0.5, 'Axes 5',ha='center',va='center',size=24,alpha=.5)
show()
findfont: Font family ['SimHei'] not found. Falling back to DejaVu Sans.
from pylab import *
axes([0.1,0.1,.8,.8])
xticks([]), yticks([])
text(0.6,0.6, 'axes big',ha='center',va='center',size=20,alpha=.5)
axes([0.2,0.4,.3,.3])
xticks([]), yticks([])
text(0.5,0.5, 'axes small',ha='center',va='center',size=16,alpha=.5)
show()

plt绘制图表汇总
| 函数 |
说明 |
| plt.plot(x,y,fmt,…) |
绘制一个坐标图 |
| plt.boxplot(data,notch,position) |
绘制一个箱形图 |
| plt.bar(left,height,width,bottom) |
绘制一个条形图 |
| plt.barh(width,bottom,left,height) |
绘制一个横向条形图 |
| plt.polar(theta, r) |
绘制极坐标图 |
| plt.pie(data, explode) |
绘制饼图 |
| plt.psd(x,NFFT=256,pad_to,Fs) |
绘制功率谱密度图 |
| plt.specgram(x,NFFT=256,pad_to,F) |
绘制谱图 |
| plt.cohere(x,y,NFFT=256,Fs) |
绘制X‐Y的相关性函数 |
| plt.scatter(x,y) |
绘制散点图,其中,x和y长度相同 |
| plt.step(x,y,where) |
绘制步阶图 |
| plt.hist(x,bins,normed) |
绘制直方图 |
| plt.contour(X,Y,Z,N) |
绘制等值图 |
| plt.vlines() |
绘制垂直图 |
| plt.stem(x,y,linefmt,markerfmt) |
绘制柴火图 |
| plt.plot_date() |
绘制数据日期 |
Matplotlib 绘图举例
import matplotlib.pyplot as plt
def setup_axes():
fig, axes = plt.subplots(ncols=3, figsize=(6.5,3))
for ax in fig.axes:
ax.set(xticks=[], yticks=[])
fig.subplots_adjust(wspace=0, left=0, right=0.93)
return fig, axes
def label(ax, text, y=0):
ax.annotate(text, xy=(0.5, 0.00), xycoords='axes fraction', ha='center',
style='italic',bbox=dict(boxstyle='round',
facecolor='floralwhite',
ec='####8B7E66'))
折线图
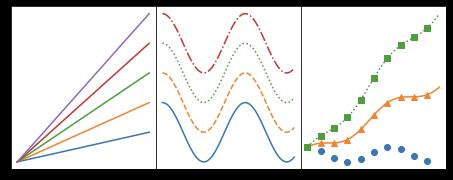
import numpy as np
import matplotlib.pyplot as plt
x = np.linspace(0, 10, 100)
fig, axes = setup_axes()
for i in range(1, 6):
axes[0].plot(x, i * x)
for i, ls in enumerate(['-', '--', ':', '-.']):
axes[1].plot(x, np.cos(x) + i, linestyle=ls)
for i, (ls, mk) in enumerate(zip(['', '-', ':'], ['o', '^', 's'])):
axes[2].plot(x, np.cos(x) + i * x, linestyle=ls, marker=mk, markevery=10)
plt.show()
散点图
import numpy as np
import matplotlib.pyplot as plt
np.random.seed(1874)
x, y, z = np.random.normal(0, 1, (3, 100))
t = np.arctan2(y, x)
size = 50 * np.cos(2 * t)**2 + 10
fig, axes = setup_axes()
axes[0].scatter(x, y, marker='o', color='darkblue', facecolor='white', s=80)
label(axes[0], 'scatter(x, y)')
axes[1].scatter(x, y, marker='s', color='darkblue', s=size)
label(axes[1], 'scatter(x, y, s)')
axes[2].scatter(x, y, s=size, c=z, cmap='gist_ncar')
label(axes[2], 'scatter(x, y, s, c)')
plt.show()

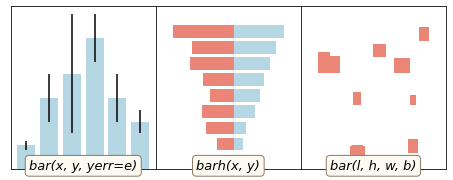
柱状图
import numpy as np
import matplotlib.pyplot as plt
def main():
fig, axes = setup_axes()
basic_bar(axes[0])
tornado(axes[1])
general(axes[2])
plt.show()
def basic_bar(ax):
y = [1, 3, 4, 5.5, 3, 2]
err = [0.2, 1, 2.5, 1, 1, 0.5]
x = np.arange(len(y))
ax.bar(x, y, yerr=err, color='lightblue', ecolor='black')
ax.margins(0.05)
ax.set_ylim(bottom=0)
label(ax, 'bar(x, y, yerr=e)')
def tornado(ax):
y = np.arange(8)
x1 = y + np.random.random(8) + 1
x2 = y + 3 * np.random.random(8) + 1
ax.barh(y, x1, color='lightblue')
ax.barh(y, -x2, color='salmon')
ax.margins(0.15)
label(ax, 'barh(x, y)')
def general(ax):
num = 10
left = np.random.randint(0, 10, num)
bottom = np.random.randint(0, 10, num)
width = np.random.random(num) + 0.5
height = np.random.random(num) + 0.5
ax.bar(left, height, width, bottom, color='salmon')
ax.margins(0.15)
label(ax, 'bar(l, h, w, b)')
main()
Matplotlib进阶


