机器学习入门和批量梯度下降法
机器学习入门
斯坦福大学Andrew Ng教授公开课:
http://openclassroom.stanford.edu/MainFolder/CoursePage.php?course=MachineLearning
目前上面的视频收录尚不完整,但校内网登上流畅。
coursera上的完整资源:https://www.coursera.org/learn/machine-learning/home/welcome
但网络登录不流畅,需观看。
课程笔记(英文版) http://www.holehouse.org/mlclass/
因为学习这个课程的人较多,中文资源也很容易找到(百度搜索“斯坦福大学公开课机器学习”),这里列出其中一个资源:http://52opencourse.com/tag/andrew+ng
推一个对课程以及对机器学习相关总结得较好的博客:http://blog.csdn.net/abcjennifer
网易公开课上的课程资源,同样来自Andrew Ng教授,但视频是课堂录像:
http://open.163.com/special/opencourse/machinelearning.html
对于机器学习(machine learning)的定义,普遍认同的有两个:
Arthur Samuel 的描述:the field of study that gives computers the ability to learn without being explicitly programmed.
Tom Mitchell 的描述:A computer program is said to learn from experience E with respect to some class of tasks T and performance measure P, if its performance at tasks in T, as measured by P, improves with experience E.
机器学习分类:有监督学习(supervised learning),无监督学习(unsupervised learning)
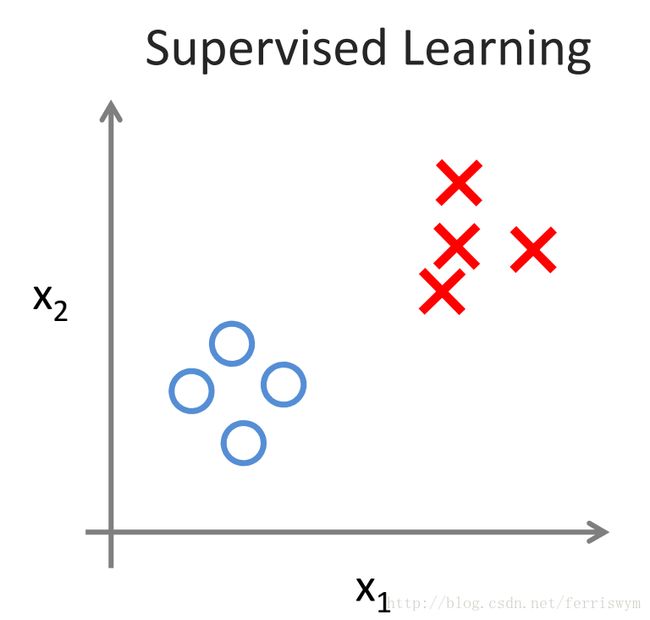
有监督学习:已知数据集的输入和输出,包括回归问题(regression)、带标签的分类问题(classification)
无监督学习:给定数据集但无确定输出,不带标签的分类问题,也称聚类问题(cluster)
Regression
给定数据的输入和输出,拟合一个连续函数,预测连续的输出。
举例:已知市场上房子的面积和对应的价格,预测一所已知房子面积的价格。

Classification
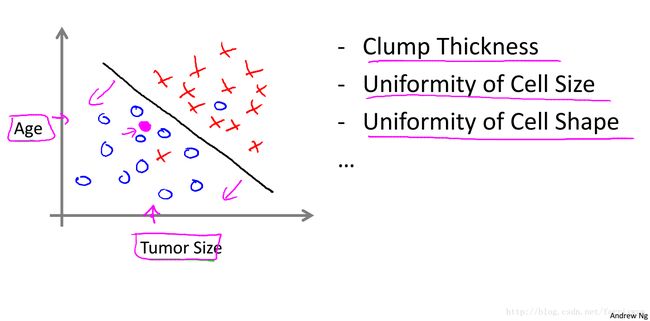
给定数据以及其所属类别,预测一个新数据的类别。(可二分类,也可分多类,输出是离散的)
举例:已知乳腺肿瘤患者的肿瘤是良性还是恶性与其肿瘤的大小有关,预测一个患者的肿瘤是良性还是恶性。
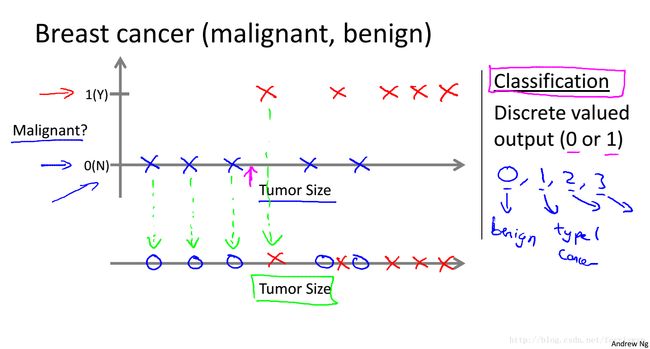
已知乳腺肿瘤患者的肿瘤是良性还是恶性与其肿瘤的大小和年龄(或更多因素)有关,预测一个患者的肿瘤是良性还是恶性。
Unsupervised learning
有监督学习和无监督学习的对比:
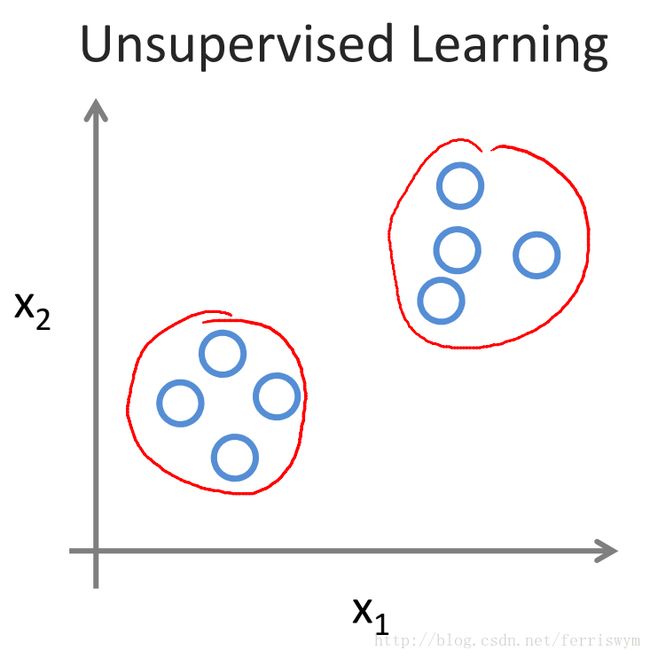
举例:谷歌新闻中把对同一个事件的报道并作一类。

线性回归(linear regression)
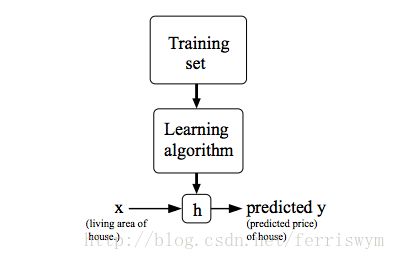
线性回归问题的目标是对给定的数据集 (x(i),y(i)) ,其中 i 表示第 i 组数据,建立 x(i) 和 y(i) 一个函数关系 h ,可对每一个输入空间X的数据,预测输出空间Y的对应一个数据。函数 h 称为假设(hypothesis)。
在线性回归问题中,假设函数为
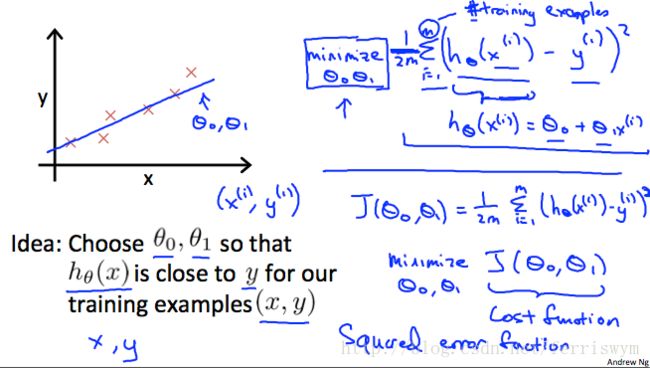
对于这里讨论的单变量情况, hθ(x)=θ0+θ1x1 ,
为保持表达形式的一致性,常令 x0=1 ,并且把 θ 和 x 向量化,得到
代价函数(cost function)是用于评价假设函数的精确度,取假设函数与输出数据的均方偏差,即
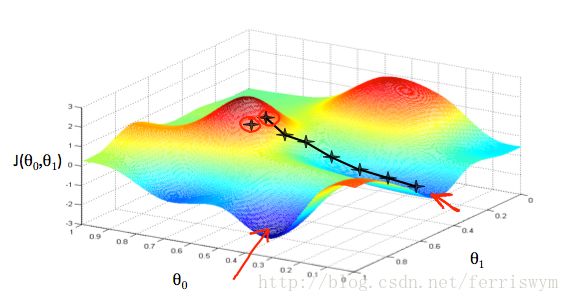
如果把 J(θ0,θ1) 的图像绘制出来,容易看出优化的目标是找到图像的最低点。
图中的蓝色部分为图像极小值点,假设红色部分为起始点,每个星星代表从起始点到求得最低点的每一步。可以通过求偏导数的方法确定每一步前进的方向,即每一步迭代:
这就是 梯度下降(gradient descent)算法,其中每一步前进的距离长短受参数 α 影响,称为 学习速率(learning rate)。 α 小则收敛速度慢, α 大则容易振荡。此外,由于 ∂∂θjJ(θ0,θ1) 项会随着斜率的的减小而自收敛,所以算法本身会收敛。
上述算法称批量梯度下降(batch gradient descent),即每一步都要查询数据集中的所有数据,因此要注意 θj 的每次更新都是所有数据一起更新。
代码实现
从年龄和体重的数据中拟合出一个假设函数,对一个确定年龄的小孩进行体重预测。问题和数据来源:
http://openclassroom.stanford.edu/MainFolder/DocumentPage.php?course=MachineLearning&doc=exercises/ex2/ex2.html
对 (1) 式进行进一步推导,得
% load data and show
x = load('ex2x.dat');
y = load('ex2y.dat');
figure
plot(x,y,'o');
ylabel('Height in meters')
xlabel('Age in years')

% initialize
m = length(y);
x = [ones(m,1),x];
theta = [0;0];
alpha = 0.07;
sum = [0;0];

% implement gradient descent
for n = 1:1500
    hyp = x * theta;                           % the linear regression model in vector
    for i = 1:m
        sum = sum + (hyp(i) - y(i))*(x(i,:))';
    end
    theta = theta - alpha/m*sum;               % batch gradient descent update
    sum = [0;0];
end

% show the result
hold on % Plot new data without clearing old plot
plot(x(:,2), x*theta, '-') % remember that x is now a matrix with 2 columns
                           % and the second column contains the time info
legend('Training data', 'Linear regression')
x_prd = [1,3.5];
hyp = x_pre * theta;
disp(['Age = 3.5, then height = ' num2str(hyp) ]);
x_prd = [1,7];
hyp = x_pre * theta;
disp(['Age = 7, then height = ' num2str(hyp) ]);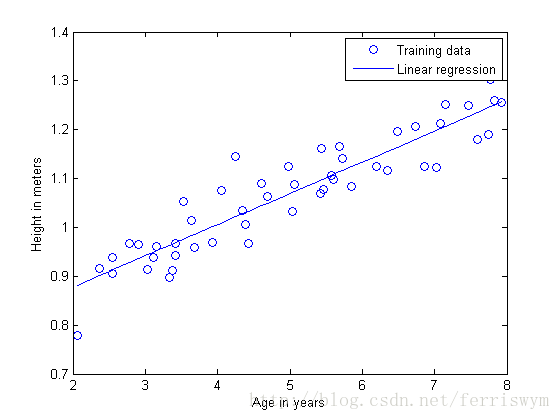
这是简单的代码实现,更详细和模块的实现参考http://blog.csdn.net/abcjennifer/article/details/7732417
