集成学习方法归纳与代码实现
组合不同的模型进行集成学习
群体决策:
一般可以从数据层面、单模型层面(比如模型调参等)、集成学习等方式提升模型性能。
Bagging:随机构造训练所使用的数据样本,随机选择特征,通过引入数据上的随机性降低模型方差,减小过拟合。
Boosting:从错误中学习,当前模型更加聚焦于上一个模型错分的样本,着力减小偏差。
from IPython.display import Image
%matplotlib inline
1.集成学习
集成学习的目标是将不同的分类器组合形成一个元分类器,该组合生成的分类器具有比单个分类器更好的泛化性能。
核心是确定集成策略,常见的方法有:投票法(硬投票法,软投票法等)、Bagging、stacking、平均法等;
平均法:
假设有 T个单模型 { h 1 , ⋯ , h t } \text { T个单模型 }\left\{h_{1}, \cdots, h_{t}\right\} T个单模型 { h1,⋯,ht},对于样本 x x x的输出为 h i ( x ) ∈ R h_i{(x)}\in{\mathbb{R}} hi(x)∈R
平均法是把单模型的输出进行加权平均,融合模型的结果如下:
H ( x ) = ∑ i = 1 T w i h i ( x ) H(x)=\sum_{i=1}^{T} w_{i} h_{i}(x) H(x)=i=1∑Twihi(x)
且 一般情况下,要求 w i ⩾ 0 , ∑ i = 1 T w i = 1 \text { 一般情况下,要求 } w_{i} \geqslant 0, \quad \sum_{i=1}^{T} w_{i}=1 一般情况下,要求 wi⩾0,∑i=1Twi=1。
一般策略:当个体学习器的性能比较均衡,可以使用简单平均;当个体学习器差异较大,则推荐使用加权平均。
投票法:根据个体学习器的输出情况,可以区分为硬投票和软投票,其中后者的输出为概率
当输出为概率的时候:
h i j ( x ) ∈ [ 0 , 1 ] , 其实它相当于对后验概率 P ( c j ∣ x ) 的一个估计 \boldsymbol{h}_{i}^{j}(x) \in[0,1], \text { 其实它相当于对后验概率 } P\left(c_{j} \mid x\right) \text { 的一个估计 } hij(x)∈[0,1], 其实它相当于对后验概率 P(cj∣x) 的一个估计
加权软投票表示如下:
H j ( x ) = ∑ i = 1 T w i j h i j ( x ) H^{j}(x)=\sum_{i=1}^{T} w_{i}^{j} h_{i}^{j}(x) Hj(x)=i=1∑Twijhij(x)
其中, w i j w_i^j wij表示的是针对单模型 h i h_i hi和类别 c i c_i ci的权重。
这里的软投票法可以正常运作的前提为:单模型都是同质的。对于不同类型的单模型,其输出的值是无法进行之别比较的。在这种情况下,可以对模型的输出进行规范化,采用譬如Platt缩放、等分回归等处理措施。也可以将输出转化为类别标记,将类概率输出最大的设置为1,其余为0.然后采用硬投票法。
Bagging:
Bagging类集成学习,基于自助采样。对于包含 m m m个样本的数据集,进行 m m m次的有放回随机采样。得到包含 m m m个样本集合,这里的样本集合中可能包含一定的重复样本。
重复上述过程 T T T次,得到 T T T个采样集,基于每个采样集训练一个单模型,得到 T T T个模型,对其进行融合。
在预测阶段,把每个单模型的结果的结果采用投票法或者平均法进行融合,得到最终结果,算法示例:随机森林模型。
Stacking:
Stacking先从初始的训练集训练出若干单模型,然后把单模型的输出结果作为样本特征进行整合,并把原始样本标记作为新数据样本标记,生成新的训练集。再根据新的训练集训练一个新的模型,最后使用新的模型对样本进行预测。本质上是一个分层结构。
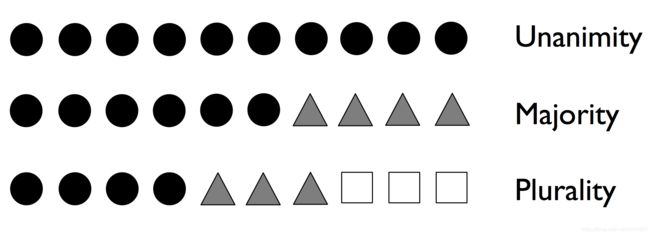
# 本文以多数投票法为例,几何表示如下
Image(filename='images/07_01.png', width=500)
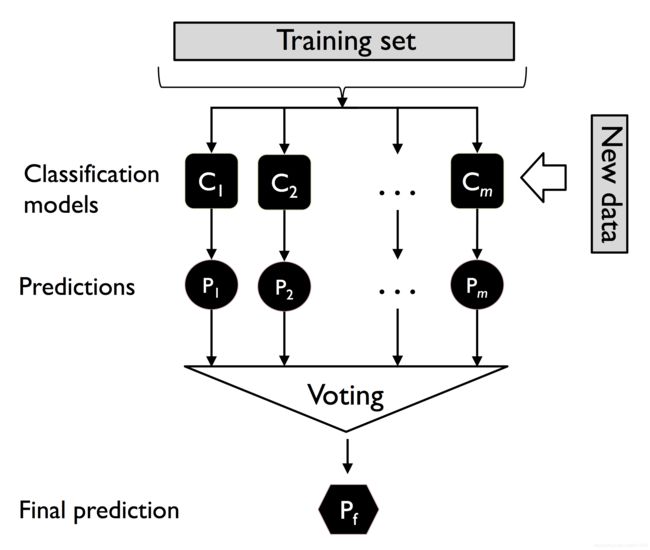
# 多数投票法的几何表示
Image(filename='images/07_02.png', width=500)
为了通过多数投票的方式预测一个类别标签,可以将每个个体分类器的预测标签 C j C_j Cj组合起来,选择票数最多的类标签作为 y ^ \hat{y} y^
y ^ = mode { C 1 ( x ) , C 2 ( x ) , … , C m ( x ) } \hat{y}=\operatorname{mode}\left\{C_{1}(\boldsymbol{x}), C_{2}(\boldsymbol{x}), \ldots, C_{m}(\boldsymbol{x})\right\} y^=mode{ C1(x),C2(x),…,Cm(x)}
这里的mode代表了一个集合中的最频繁事件或者结果,例如: m o d e { 1 , 2 , 1 , 1 , 2 , 4 , 5 , 4 } mode\left\{1,2,1,1,2,4,5,4\right\} mode{ 1,2,1,1,2,4,5,4}=1.
示例:
对于一个二分类任务,class1=-1, class2=+1。则可以将多数投票表决写成如下形式:
C ( x ) = sign [ ∑ j m C j ( x ) ] = { 1 if ∑ j C j ( x ) ≥ 0 − 1 otherwise C(\boldsymbol{x})=\operatorname{sign}\left[\sum_{j}^{m} C_{j}(\boldsymbol{x})\right]=\left\{\begin{array}{cc} 1 & \text { if } \sum_{j} C_{j}(\boldsymbol{x}) \geq 0 \\ -1 & \text { otherwise } \end{array}\right. C(x)=sign[j∑mCj(x)]={ 1−1 if ∑jCj(x)≥0 otherwise
对于集成方法为什么可以表现的比单个学习器更好的解释:
假设: n n n个用于二分类的基分类器有着相同的错误率 E \mathcal{E} E,
假设: n n n个分类器相互独立,而且分类错误率 E \mathcal{E} E互不相关
基于上述假设,将基于基分类器的集成分类器的错误率表示为二项分布的概率质量函数:
P ( y ≥ k ) = ∑ k n ( n k ) ε k ( 1 − ε ) n − k = ε ensemble P(y \geq k)=\sum_{k}^{n}\left(\begin{array}{l} n \\ k \end{array}\right) \varepsilon^{k}(1-\varepsilon)^{n-k}=\varepsilon_{\text {ensemble }} P(y≥k)=k∑n(nk)εk(1−ε)n−k=εensemble
这里的 ( n k ) \left(\begin{array}{l} n \\ k \end{array}\right) (nk)代表从 n n n中选择 K K K个。换句话说,这里计算的是集成模型预测错误的概率。
对于一个具体的例子,当 n = 11 n=11 n=11, E = 0.25 \mathcal{E}=0.25 E=0.25.上式的具体表示形式如下:
P ( y ≥ k ) = ∑ k = 6 11 ⟨ 11 k ⟩ 0.2 5 k ( 1 − 0.25 ) 11 − k = 0.034 P(y \geq k)=\sum_{k=6}^{11}\left\langle\begin{array}{l} 11 \\ k \end{array}\right\rangle 0.25^{k}(1-0.25)^{11-k}=0.034 P(y≥k)=k=6∑11⟨11k⟩0.25k(1−0.25)11−k=0.034
二项式系数:
C n k = n ! k ! × ( n − k ) ! C_{n}^{k}=\frac{n !}{k ! \times(n-k) !} Cnk=k!×(n−k)!n!
例如, 3 ! = 3 ⋅ 2 ⋅ 1 = 6 3!=3\cdot2\cdot1=6 3!=3⋅2⋅1=6
可以看到,集成模型的错误率为0.034,远小于个体学习器的错误率。
# 这里如果发生了对半分的情况,将被视为错误。如100个分类器,50个错误
# 在python中实现概率质量函数
from scipy.special import comb
import math

def ensemble_error(n_classifier, error):
    k_start = int(math.ceil(n_classifier / 2.))
    probs = [comb(n_classifier, k) * error**k * (1-error)**(n_classifier - k)
             for k in range(k_start, n_classifier + 1)]
    return sum(probs)
# 基分类器个数为11,错误率为0.25
ensemble_error(n_classifier=11, error=0.25)
0.03432750701904297
import numpy as np

# 假定错误范围为0.1到1.01
error_range = np.arange(0.0, 1.01, 0.01)
ens_errors = [ensemble_error(n_classifier=11, error=error)
              for error in error_range]
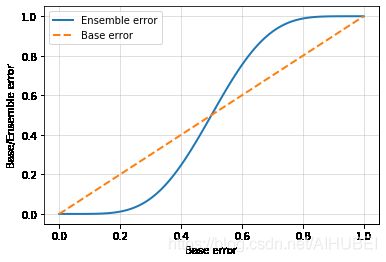
# 将个体学习器和集成模型之间的错误率关系进行可视化
import matplotlib.pyplot as plt

plt.plot(error_range,
         ens_errors,
         label='Ensemble error',
         linewidth=2)

plt.plot(error_range,
         error_range,
         linestyle='--',
         label='Base error',
         linewidth=2)

plt.xlabel('Base error')
plt.ylabel('Base/Ensemble error')
plt.legend(loc='upper left')
plt.grid(alpha=0.5)
#plt.savefig('images/07_03.png', dpi=300)
plt.show()
可以看出,当基学习器的错误率低于0.5,即表现得比随机猜测好一些,则集成模型的错误率总是比个体学习器更低。
1.1多数投票法对个体学习器进行组合
定义如下:
y ^ = arg max i ∑ j = 1 m w j χ A ( C j ( x ) = i ) \hat{y}=\arg \max _{i} \sum_{j=1}^{m} w_{j} \chi_{A}\left(C_{j}(\boldsymbol{x})=i\right) y^=argimaxj=1∑mwjχA(Cj(x)=i)
这里的 w j w_j wj为个体分类器 C j C_j Cj的权重, y ^ \hat{y} y^为集成模型的预测标签。 A A A为类别标签的集合set。 χ A \chi_{A} χA为指示函数。
当第 j j j个人类器满足 ( C j ( x ) = i ) \left(C_{j}(\boldsymbol{x})=i\right) (Cj(x)=i)时,返回1.
上述等式可以简化为如下形式:
y ^ = mode { C 1 ( x ) , C 2 ( x ) , … , C m ( x ) } \hat{y}=\operatorname{mode}\left\{C_{1}(\boldsymbol{x}), C_{2}(\boldsymbol{x}), \ldots, C_{m}(\boldsymbol{x})\right\} y^=mode{ C1(x),C2(x),…,Cm(x)}
对于权重的理解:
假设现有一个集成模型,其通过集成三个基模型 C j ( j ∈ { 0 , 1 } ) C_j(j\in\left\{0,1\right\}) Cj(j∈{ 0,1}),基模型预测结果为 C j ( x ) ∈ { 0 , 1 } C_j(\boldsymbol{x})\in{\left\{0,1\right\}} Cj(x)∈{ 0,1}.
对于一个指定的样本 x \boldsymbol{x} x,有两个基模型 C 1 和 C 2 C_1和C_2 C1和C2预测为0,余下的一个基模型 C 3 C_3 C3预测为1。若对每个基分类器的预测施加相同的权重,则通过多数投票表决得到的集成模型最终预测结果为类别0。
C 1 ( x ) → 0 , C 2 ( x ) → 0 , C 3 ( x ) → 1 y ^ = mode { 0 , 0 , 1 } = 0 \begin{array}{c} C_{1}(\boldsymbol{x}) \rightarrow 0, \quad C_{2}(\boldsymbol{x}) \rightarrow 0, \quad C_{3}(\boldsymbol{x}) \rightarrow 1 \\ \hat{y}=\operatorname{mode}\{0,0,1\}=0 \end{array} C1(x)→0,C2(x)→0,C3(x)→1y^=mode{ 0,0,1}=0
假定基于不同权重:
指定基模型 C 3 C_3 C3的权重为0.6;基模型 C 1 和 C 2 C_1和C_2 C1和C2的权重为0.2,则进一步有:
y ^ = arg max i ∑ j = 1 m w j χ A ( C j ( x ) = i ) = arg max i [ 0.2 × i 0 + 0.2 × i 0 + 0.6 × i 1 ] = 1 \begin{aligned} \hat{y} &=\arg \max _{i} \sum_{j=1}^{m} w_{j} \chi_{A}\left(C_{j}(\boldsymbol{x})=i\right) \\ &=\arg \max _{i}\left[0.2 \times i_{0}+0.2 \times i_{0}+0.6 \times i_{1}\right]=1 \end{aligned} y^=argimaxj=1∑mwjχA(Cj(x)=i)=argimax[0.2×i0+0.2×i0+0.6×i1]=1
因为指定了基模型 C 3 C_3 C3的权重为基模型 C 1 和 C 2 C_1和C_2 C1和C2权重的三倍,因此可以等同理解为:基模型 C 3 C_3 C3的预测结果相较于基模型 C 1 和 C 2 C_1和C_2 C1和C2有着三倍的说服力:形式化表示如下
y ^ = mode { 0 , 0 , 1 , 1 , 1 } = 1 \hat{y}=\operatorname{mode}\{0,0,1,1,1\}=1 y^=mode{ 0,0,1,1,1}=1
1.2利用python实现简单加权投票集成
import numpy as np

# 基于numpy工具包和bincount函数

np.argmax(np.bincount([0, 0, 1],
                      weights=[0.2, 0.2, 0.6]))
1
1.3加权软投票
上文已经说了,根据模型最终输出的类型不同,可以将投票法区分为硬投票和软投票。其中软投票法针对的是:模型的输出为概率值。
即便是分类模型,也可以通过prodict_proba函数进行回归输出,即预测输出的为概率值。
此时,集成模型的输出形式化表示如下;
y ^ = arg max i ∑ j = 1 m w j p i j \hat{y}=\arg \max _{i} \sum_{j=1}^{m} w_{j} p_{i j} y^=argimaxj=1∑mwjpij
这里的 p i j p_{i j} pij代表的是:第 j j j个分类器针对类别标签 i i i的预测结果。
示例假设:
对于一个二分类问题,标签为 i ∈ { 0 , 1 } i\in \left\{0, 1\right\} i∈{ 0,1}。集成模型通过三个基模型集成而来,即 C j ( j ∈ { 1 , 2 , 3 } ) C_j(j\in\left\{1,2,3\right\}) Cj(j∈{ 1,2,3})。
假设,各分类器针对指定样本 x \boldsymbol{x} x的预测结果如下:
C 1 ( x ) → [ 0.9 , 0.1 ] , C 2 ( x ) → [ 0.8 , 0.2 ] , C 3 ( x ) → [ 0.4 , 0.6 ] C_{1}(\boldsymbol{x}) \rightarrow[0.9,0.1], \quad C_{2}(\boldsymbol{x}) \rightarrow[0.8,0.2], C_{3}(\boldsymbol{x}) \rightarrow[0.4,0.6] C1(x)→[0.9,0.1],C2(x)→[0.8,0.2],C3(x)→[0.4,0.6]
则通过指定各分类器权重分别为0.2, 0.2, 0.6,可得最终模型预测结果如下:
p ( i 0 ∣ x ) = 0.2 × 0.9 + 0.2 × 0.8 + 0.6 × 0.4 = 0.58 p ( i 1 ∣ x ) = 0.2 × 0.1 + 0.2 × 0.2 + 0.6 × 0.6 = 0.42 y ^ = arg max i [ p ( i 0 ∣ x ) , p ( i 1 ∣ x ) ] = 0 \begin{aligned} p\left(i_{0} \mid \boldsymbol{x}\right) &=0.2 \times 0.9+0.2 \times 0.8+0.6 \times 0.4=0.58 \\ p\left(i_{1} \mid \boldsymbol{x}\right) &=0.2 \times 0.1+0.2 \times 0.2+0.6 \times 0.6=0.42 \\ \hat{y} &=\arg \max _{i}\left[p\left(i_{0} \mid \boldsymbol{x}\right), p\left(i_{1} \mid \boldsymbol{x}\right)\right]=0 \end{aligned} p(i0∣x)p(i1∣x)y^=0.2×0.9+0.2×0.8+0.6×0.4=0.58=0.2×0.1+0.2×0.2+0.6×0.6=0.42=argimax[p(i0∣x),p(i1∣x)]=0
1.4 利用python实现简单加权软投票
# 利用工具包numpy和np.average以及np.argmax
ex = np.array([[0.9, 0.1],
               [0.8, 0.2],
               [0.4, 0.6]])

p = np.average(ex,
               axis=0,
               weights=[0.2, 0.2, 0.6])
p
array([0.58, 0.42])
# 最终预测结果,为上述计算结果中值大的一方所代表的的类别
np.argmax(p)
0
# 总程序----多数投票法
from sklearn.base import BaseEstimator
from sklearn.base import ClassifierMixin

# 通过使用BaseEstimator核ClassfierMixin来方便地实现一些函数
from sklearn.preprocessing import LabelEncoder
from sklearn.base import clone
from sklearn.pipeline import _name_estimators
import numpy as np
import operator

# 其中,vote=‘classlabel’和vote='probability'分别代表了预测类型为标签和概率

class MajorityVoteClassifier(BaseEstimator,
                             ClassifierMixin):

    def __init__(self, classifiers, vote='classlabel', weights=None):

        self.classifiers = classifiers
        self.named_classifiers = {
     key: value for key, value
                                  in _name_estimators(classifiers)}
        self.vote = vote
        self.weights = weights

    def fit(self, X, y):

        if self.vote not in ('probability', 'classlabel'):
            raise ValueError("vote must be 'probability' or 'classlabel'"
                             "; got (vote=%r)"
                             % self.vote)

        if self.weights and len(self.weights) != len(self.classifiers):
            raise ValueError('Number of classifiers and weights must be equal'
                             '; got %d weights, %d classifiers'
                             % (len(self.weights), len(self.classifiers)))

        # Use LabelEncoder to ensure class labels start with 0, which
        # is important for np.argmax call in self.predict
        self.lablenc_ = LabelEncoder()
        self.lablenc_.fit(y)
        self.classes_ = self.lablenc_.classes_
        self.classifiers_ = []
        for clf in self.classifiers:
            fitted_clf = clone(clf).fit(X, self.lablenc_.transform(y))
            self.classifiers_.append(fitted_clf)
        return self

    def predict(self, X):

        if self.vote == 'probability':
            maj_vote = np.argmax(self.predict_proba(X), axis=1)
        else:  # 'classlabel' vote

            #  Collect results from clf.predict calls
            predictions = np.asarray([clf.predict(X)
                                      for clf in self.classifiers_]).T

            maj_vote = np.apply_along_axis(
                                      lambda x:
                                      np.argmax(np.bincount(x,
                                                weights=self.weights)),
                                      axis=1,
                                      arr=predictions)
        maj_vote = self.lablenc_.inverse_transform(maj_vote)
        return maj_vote

    def predict_proba(self, X):

        probas = np.asarray([clf.predict_proba(X)
                             for clf in self.classifiers_])
        avg_proba = np.average(probas, axis=0, weights=self.weights)
        return avg_proba

    # 定义了get_params方法来获得个体学习器相关的参数
    def get_params(self, deep=True):
        """ Get classifier parameter names for GridSearch"""
        if not deep:
            return super(MajorityVoteClassifier, self).get_params(deep=False)
        else:
            out = self.named_classifiers.copy()
            for name, step in self.named_classifiers.items():
                for key, value in step.get_params(deep=True).items():
                    out['%s__%s' % (name, key)] = value
            return out
实际上,上面实现的内容,在sklearn.ensemble.VotingClassifier中都已经做了实现。
2.使用多数投票策略进行预测
# 使用鸢尾花数据集,选择两个特征,分别为sepal width和petal length
from sklearn import datasets
from sklearn.preprocessing import StandardScaler
from sklearn.preprocessing import LabelEncoder
from sklearn.model_selection import train_test_split

iris = datasets.load_iris() # 导入数据
X, y = iris.data[50:, [1, 2]], iris.target[50:]
# 标签编码映射,实现字符串型的标签数值化
le = LabelEncoder()
y = le.fit_transform(y)

# 划分训练集和测试集
X_train, X_test, y_train, y_test =\
       train_test_split(X, y,
                        test_size=0.5,
                        random_state=1,
                        stratify=y)
在sklearn中,为了计算ROC和AUC值,模型做预测的时候,使用的方法为preidct_proba
# 训练三个分类器,分别为逻辑回归,决策树,K近邻
import numpy as np
from sklearn.linear_model import LogisticRegression
from sklearn.tree import DecisionTreeClassifier
from sklearn.neighbors import KNeighborsClassifier
from sklearn.pipeline import Pipeline

# 在将上述三个模型进行集成之前,通过10-折交叉验证来评估基模型的性能
from sklearn.model_selection import cross_val_score

# 初始化三个基模型
clf1 = LogisticRegression(penalty='l2',
                          C=0.001,
                          solver='lbfgs',
                          random_state=1)

clf2 = DecisionTreeClassifier(max_depth=1,
                              criterion='entropy',
                              random_state=0)

clf3 = KNeighborsClassifier(n_neighbors=1,
                            p=2,
                            metric='minkowski')

# 树模型尺度不敏感,无需进行标准化
pipe1 = Pipeline([['sc', StandardScaler()],
                  ['clf', clf1]])
pipe3 = Pipeline([['sc', StandardScaler()],
                  ['clf', clf3]])

clf_labels = ['Logistic regression', 'Decision tree', 'KNN']

# 10折交叉验证
print('10-fold cross validation:\n')
for clf, label in zip([pipe1, clf2, pipe3], clf_labels):
    scores = cross_val_score(estimator=clf,
                             X=X_train,
                             y=y_train,
                             cv=10,
                             scoring='roc_auc')
    print("ROC AUC: %0.2f (+/- %0.2f) [%s]"
          % (scores.mean(), scores.std(), label))
10-fold cross validation:

ROC AUC: 0.92 (+/- 0.15) [Logistic regression]
ROC AUC: 0.87 (+/- 0.18) [Decision tree]
ROC AUC: 0.85 (+/- 0.13) [KNN]
# 多数表决,硬投票

mv_clf = MajorityVoteClassifier(classifiers=[pipe1, clf2, pipe3])

clf_labels += ['Majority voting']
all_clf = [pipe1, clf2, pipe3, mv_clf]

for clf, label in zip(all_clf, clf_labels):
    scores = cross_val_score(estimator=clf,
                             X=X_train,
                             y=y_train,
                             cv=10,
                             scoring='roc_auc')
    print("ROC AUC: %0.2f (+/- %0.2f) [%s]"
          % (scores.mean(), scores.std(), label))
ROC AUC: 0.92 (+/- 0.15) [Logistic regression]
ROC AUC: 0.87 (+/- 0.18) [Decision tree]
ROC AUC: 0.85 (+/- 0.13) [KNN]
ROC AUC: 0.98 (+/- 0.05) [Majority voting]
可以看出,集成模型的性能相较于单一模型有了一定的提升。
3.对集成模型进行参数调整和评估
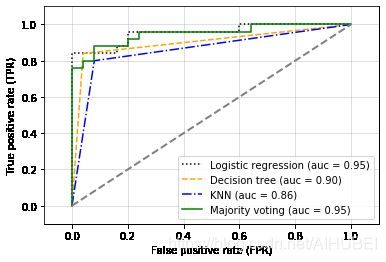
这里通过计算集成模型在测试集上的ROC和AUC来评估模型针对未知数据的泛化性能。测试数据并非用来进行模型选择,而是用于报告一个分类器系统泛化性能的无偏估计。
# 绘制ROC曲线
from sklearn.metrics import roc_curve
from sklearn.metrics import auc

import matplotlib.pyplot as plt

colors = ['black', 'orange', 'blue', 'green']
linestyles = [':', '--', '-.', '-']
for clf, label, clr, ls \
        in zip(all_clf,
               clf_labels, colors, linestyles):

    # 假定正样本类别为“1”
    y_pred = clf.fit(X_train,
                     y_train).predict_proba(X_test)[:, 1]
    fpr, tpr, thresholds = roc_curve(y_true=y_test,
                                     y_score=y_pred)
    roc_auc = auc(x=fpr, y=tpr)
    plt.plot(fpr, tpr,
             color=clr,
             linestyle=ls,
             label='%s (auc = %0.2f)' % (label, roc_auc))

plt.legend(loc='lower right')
plt.plot([0, 1], [0, 1],
         linestyle='--',
         color='gray',
         linewidth=2)

plt.xlim([-0.1, 1.1])
plt.ylim([-0.1, 1.1])
plt.grid(alpha=0.5)
plt.xlabel('False positive rate (FPR)')
plt.ylabel('True positive rate (TPR)')


#plt.savefig('images/07_04', dpi=300)
plt.show()
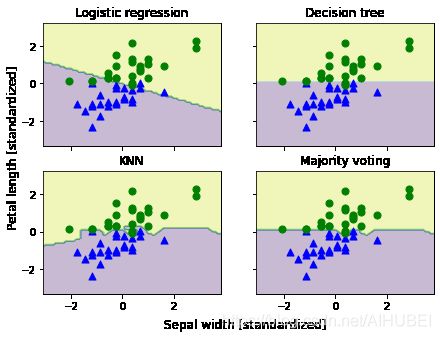
可以看出,集成模型在测试集上的性能比较好,AUC达到了0.95.
但是也可以看出,逻辑回归模型在相同的数据集上有着同样的表现,这有可能是因为在给定的小数据集上所具有的高方差,在这里,也可能是因为对数据集拆分敏感。
这里仅仅选择了两个特征,所以可以进一步可视化实际的决策边界。
# 上述的基模型中,逻辑回归和K近邻模型对于特征尺度敏感,这里进行数据标准化
# 同时也是为了将数据缩放到相同的尺度以便更好地进行可视化比较
sc = StandardScaler()
X_train_std = sc.fit_transform(X_train)
from itertools import product

all_clf = [pipe1, clf2, pipe3, mv_clf]

x_min = X_train_std[:, 0].min() - 1
x_max = X_train_std[:, 0].max() + 1
y_min = X_train_std[:, 1].min() - 1
y_max = X_train_std[:, 1].max() + 1

xx, yy = np.meshgrid(np.arange(x_min, x_max, 0.1),
                     np.arange(y_min, y_max, 0.1))

f, axarr = plt.subplots(nrows=2, ncols=2,
                        sharex='col',
                        sharey='row',
                        figsize=(7, 5))

for idx, clf, tt in zip(product([0, 1], [0, 1]),
                        all_clf, clf_labels):
    clf.fit(X_train_std, y_train)

    Z = clf.predict(np.c_[xx.ravel(), yy.ravel()])
    Z = Z.reshape(xx.shape)

    axarr[idx[0], idx[1]].contourf(xx, yy, Z, alpha=0.3)

    axarr[idx[0], idx[1]].scatter(X_train_std[y_train==0, 0],
                                  X_train_std[y_train==0, 1],
                                  c='blue',
                                  marker='^',
                                  s=50)

    axarr[idx[0], idx[1]].scatter(X_train_std[y_train==1, 0],
                                  X_train_std[y_train==1, 1],
                                  c='green',
                                  marker='o',
                                  s=50)

    axarr[idx[0], idx[1]].set_title(tt)

plt.text(-3.5, -5.,
         s='Sepal width [standardized]',
         ha='center', va='center', fontsize=12)
plt.text(-12.5, 4.5,
         s='Petal length [standardized]',
         ha='center', va='center',
         fontsize=12, rotation=90)

#plt.savefig('images/07_05', dpi=300)
plt.show()
mv_clf.get_params()
{'pipeline-1': Pipeline(steps=[('sc', StandardScaler()),
                 ['clf', LogisticRegression(C=0.001, random_state=1)]]),
 'decisiontreeclassifier': DecisionTreeClassifier(criterion='entropy', max_depth=1, random_state=0),
 'pipeline-2': Pipeline(steps=[('sc', StandardScaler()),
                 ['clf', KNeighborsClassifier(n_neighbors=1)]]),
 'pipeline-1__memory': None,
 'pipeline-1__steps': [('sc', StandardScaler()),
  ['clf', LogisticRegression(C=0.001, random_state=1)]],
 'pipeline-1__verbose': False,
 'pipeline-1__sc': StandardScaler(),
 'pipeline-1__clf': LogisticRegression(C=0.001, random_state=1),
 'pipeline-1__sc__copy': True,
 'pipeline-1__sc__with_mean': True,
 'pipeline-1__sc__with_std': True,
 'pipeline-1__clf__C': 0.001,
 'pipeline-1__clf__class_weight': None,
 'pipeline-1__clf__dual': False,
 'pipeline-1__clf__fit_intercept': True,
 'pipeline-1__clf__intercept_scaling': 1,
 'pipeline-1__clf__l1_ratio': None,
 'pipeline-1__clf__max_iter': 100,
 'pipeline-1__clf__multi_class': 'auto',
 'pipeline-1__clf__n_jobs': None,
 'pipeline-1__clf__penalty': 'l2',
 'pipeline-1__clf__random_state': 1,
 'pipeline-1__clf__solver': 'lbfgs',
 'pipeline-1__clf__tol': 0.0001,
 'pipeline-1__clf__verbose': 0,
 'pipeline-1__clf__warm_start': False,
 'decisiontreeclassifier__ccp_alpha': 0.0,
 'decisiontreeclassifier__class_weight': None,
 'decisiontreeclassifier__criterion': 'entropy',
 'decisiontreeclassifier__max_depth': 1,
 'decisiontreeclassifier__max_features': None,
 'decisiontreeclassifier__max_leaf_nodes': None,
 'decisiontreeclassifier__min_impurity_decrease': 0.0,
 'decisiontreeclassifier__min_impurity_split': None,
 'decisiontreeclassifier__min_samples_leaf': 1,
 'decisiontreeclassifier__min_samples_split': 2,
 'decisiontreeclassifier__min_weight_fraction_leaf': 0.0,
 'decisiontreeclassifier__presort': 'deprecated',
 'decisiontreeclassifier__random_state': 0,
 'decisiontreeclassifier__splitter': 'best',
 'pipeline-2__memory': None,
 'pipeline-2__steps': [('sc', StandardScaler()),
  ['clf', KNeighborsClassifier(n_neighbors=1)]],
 'pipeline-2__verbose': False,
 'pipeline-2__sc': StandardScaler(),
 'pipeline-2__clf': KNeighborsClassifier(n_neighbors=1),
 'pipeline-2__sc__copy': True,
 'pipeline-2__sc__with_mean': True,
 'pipeline-2__sc__with_std': True,
 'pipeline-2__clf__algorithm': 'auto',
 'pipeline-2__clf__leaf_size': 30,
 'pipeline-2__clf__metric': 'minkowski',
 'pipeline-2__clf__metric_params': None,
 'pipeline-2__clf__n_jobs': None,
 'pipeline-2__clf__n_neighbors': 1,
 'pipeline-2__clf__p': 2,
 'pipeline-2__clf__weights': 'uniform'}
from sklearn.model_selection import GridSearchCV


params = {
     'decisiontreeclassifier__max_depth': [1, 2],
          'pipeline-1__clf__C': [0.001, 0.1, 100.0]}

grid = GridSearchCV(estimator=mv_clf,
                    param_grid=params,
                    cv=10,
                    iid=False,
                    scoring='roc_auc')
grid.fit(X_train, y_train)

for r, _ in enumerate(grid.cv_results_['mean_test_score']):
    print("%0.3f +/- %0.2f %r"
          % (grid.cv_results_['mean_test_score'][r],
             grid.cv_results_['std_test_score'][r] / 2.0,
             grid.cv_results_['params'][r]))
0.983 +/- 0.02 {'decisiontreeclassifier__max_depth': 1, 'pipeline-1__clf__C': 0.001}
0.983 +/- 0.02 {'decisiontreeclassifier__max_depth': 1, 'pipeline-1__clf__C': 0.1}
0.967 +/- 0.05 {'decisiontreeclassifier__max_depth': 1, 'pipeline-1__clf__C': 100.0}
0.983 +/- 0.02 {'decisiontreeclassifier__max_depth': 2, 'pipeline-1__clf__C': 0.001}
0.983 +/- 0.02 {'decisiontreeclassifier__max_depth': 2, 'pipeline-1__clf__C': 0.1}
0.967 +/- 0.05 {'decisiontreeclassifier__max_depth': 2, 'pipeline-1__clf__C': 100.0}


D:\installation\anaconda3\lib\site-packages\sklearn\model_selection\_search.py:849: FutureWarning: The parameter 'iid' is deprecated in 0.22 and will be removed in 0.24.
  "removed in 0.24.", FutureWarning
print('Best parameters: %s' % grid.best_params_)
print('Accuracy: %.2f' % grid.best_score_)
Best parameters: {'decisiontreeclassifier__max_depth': 1, 'pipeline-1__clf__C': 0.001}
Accuracy: 0.98
grid.best_estimator_.classifiers
[Pipeline(steps=[('sc', StandardScaler()),
                 ['clf', LogisticRegression(C=0.001, random_state=1)]]),
 DecisionTreeClassifier(criterion='entropy', max_depth=1, random_state=0),
 Pipeline(steps=[('sc', StandardScaler()),
                 ['clf', KNeighborsClassifier(n_neighbors=1)]])]
mv_clf = grid.best_estimator_
mv_clf.set_params(**grid.best_estimator_.get_params())
MajorityVoteClassifier(classifiers=[Pipeline(steps=[('sc', StandardScaler()),
                                                    ('clf',
                                                     LogisticRegression(C=0.001,
                                                                        random_state=1))]),
                                    DecisionTreeClassifier(criterion='entropy',
                                                           max_depth=1,
                                                           random_state=0),
                                    Pipeline(steps=[('sc', StandardScaler()),
                                                    ('clf',
                                                     KNeighborsClassifier(n_neighbors=1))])])
mv_clf
MajorityVoteClassifier(classifiers=[Pipeline(steps=[('sc', StandardScaler()),
                                                    ('clf',
                                                     LogisticRegression(C=0.001,
                                                                        random_state=1))]),
                                    DecisionTreeClassifier(criterion='entropy',
                                                           max_depth=1,
                                                           random_state=0),
                                    Pipeline(steps=[('sc', StandardScaler()),
                                                    ('clf',
                                                     KNeighborsClassifier(n_neighbors=1))])])
4.利用Bagging进行集成学习
Bagging类集成策略很类似于之前的多数表决法,但是
Bagging类方法没有使用相同的训练数据来进行基模型的训练,它从原始的数据集中抽取bootstrap样本。
几何表示如下:
# Bagging类集成学习几何表示
Image(filename='./images/07_06.png', width=500)
4.1Bagging的简单描述
Image(filename='./images/07_07.png', width=400)
上图,代表有7个不同样本,分别进行有放回的采样。针对原始数据集分别进行采样,将每一轮的采样集分别用于训练一个分类器 C j C_j Cj。
很明显,每个数据子集都包含一定的重复数据,同时由于采样,以至于部分样本不会出现在数据集中。
有放回的重复采样:
假设,有 n n n个样本,则每个样本被抽中的概率为 1 n \frac{1}{n} n1。对应的没有被抽中的概率为 1 − 1 n 1-\frac{1}{n} 1−n1.
那么, n n n次采样之后依然没有被抽中的概率为: ( 1 − 1 n ) n (1-\frac{1}{n})^n (1−n1)n。计算极限如下:
lim n → ∞ ( 1 − 1 n ) n = e − 1 ≈ 0.368 \lim _{n \rightarrow \infty}\left(1-\frac{1}{n}\right)^{n}=\mathrm{e}^{-1} \approx 0.368 n→∞lim(1−n1)n=e−1≈0.368
随机森林算法: 随机森林在拟合训练个体树模型的时候,使用的是随机特征子集。
4.2利用Bagging对葡萄酒数据进行分类
# 数据载入,这里仅使用类别2和类别3,选择使用两个特征
import pandas as pd

df_wine = pd.read_csv('https://archive.ics.uci.edu/ml/'
                      'machine-learning-databases/wine/wine.data',
                      header=None)

df_wine.columns = ['Class label', 'Alcohol', 'Malic acid', 'Ash',
                   'Alcalinity of ash', 'Magnesium', 'Total phenols',
                   'Flavanoids', 'Nonflavanoid phenols', 'Proanthocyanins',
                   'Color intensity', 'Hue', 'OD280/OD315 of diluted wines',
                   'Proline']

# if the Wine dataset is temporarily unavailable from the
# UCI machine learning repository, un-comment the following line
# of code to load the dataset from a local path:

# df_wine = pd.read_csv('wine.data', header=None)

# drop 1 class
df_wine = df_wine[df_wine['Class label'] != 1]

y = df_wine['Class label'].values
X = df_wine[['Alcohol', 'OD280/OD315 of diluted wines']].values
# 数据集划分,划分比例为8:2
from sklearn.preprocessing import LabelEncoder
from sklearn.model_selection import train_test_split

# 对原本为字符串型的标签进行编码,实现数值化,编码结果为0到n-1
le = LabelEncoder()
y = le.fit_transform(y)

X_train, X_test, y_train, y_test =\
            train_test_split(X, y,
                             test_size=0.2,
                             random_state=1,
                             stratify=y)
# sklearn中已经有实现好的BaggingClassifier
from sklearn.ensemble import BaggingClassifier
from sklearn.tree import DecisionTreeClassifier

tree = DecisionTreeClassifier(criterion='entropy',
                              max_depth=None,
                              random_state=1)

# 使用一个未经过剪枝的决策树模型作为基分类器,创建一个包含500个决策树的集成模型来进行对不同采样集的拟合
bag = BaggingClassifier(base_estimator=tree,
                        n_estimators=500,
                        max_samples=1.0,
                        max_features=1.0,
                        bootstrap=True,
                        bootstrap_features=False,
                        n_jobs=1,
                        random_state=1)
from sklearn.metrics import accuracy_score

tree = tree.fit(X_train, y_train)
y_train_pred = tree.predict(X_train)
y_test_pred = tree.predict(X_test)

tree_train = accuracy_score(y_train, y_train_pred)
tree_test = accuracy_score(y_test, y_test_pred)
print('Decision tree train/test accuracies %.3f/%.3f'
      % (tree_train, tree_test))

"""
可以看出,未经剪枝的决策树在训练样本上的所有预测都正确,但是在测试集上表现不佳,即模型有着高方差----过拟合
"""

"""
以下是基于Bagging的集成模型,
"""
bag = bag.fit(X_train, y_train)
y_train_pred = bag.predict(X_train)
y_test_pred = bag.predict(X_test)

bag_train = accuracy_score(y_train, y_train_pred)
bag_test = accuracy_score(y_test, y_test_pred)
print('Bagging train/test accuracies %.3f/%.3f'
      % (bag_train, bag_test))
Decision tree train/test accuracies 1.000/0.833
Bagging train/test accuracies 1.000/0.917
# 对比Bagging Classifier和决策树模型的决策边界
import numpy as np
import matplotlib.pyplot as plt

x_min = X_train[:, 0].min() - 1
x_max = X_train[:, 0].max() + 1
y_min = X_train[:, 1].min() - 1
y_max = X_train[:, 1].max() + 1

xx, yy = np.meshgrid(np.arange(x_min, x_max, 0.1),
                     np.arange(y_min, y_max, 0.1))

f, axarr = plt.subplots(nrows=1, ncols=2,
                        sharex='col',
                        sharey='row',
                        figsize=(8, 3))


for idx, clf, tt in zip([0, 1],
                        [tree, bag],
                        ['Decision tree', 'Bagging']):
    clf.fit(X_train, y_train)

    Z = clf.predict(np.c_[xx.ravel(), yy.ravel()])
    Z = Z.reshape(xx.shape)

    axarr[idx].contourf(xx, yy, Z, alpha=0.3)
    axarr[idx].scatter(X_train[y_train == 0, 0],
                       X_train[y_train == 0, 1],
                       c='blue', marker='^')

    axarr[idx].scatter(X_train[y_train == 1, 0],
                       X_train[y_train == 1, 1],
                       c='green', marker='o')

    axarr[idx].set_title(tt)

axarr[0].set_ylabel('Alcohol', fontsize=12)

plt.tight_layout()
plt.text(0, -0.2,
         s='OD280/OD315 of diluted wines',
         ha='center',
         va='center',
         fontsize=12,
         transform=axarr[1].transAxes)

#plt.savefig('images/07_08.png', dpi=300, bbox_inches='tight')
plt.show()
可以看出,Bagging的决策边界更加平滑。
在实践中,复杂的分类任务和高维度的数据很容易导致模型的过拟合,这正是Bagging类算法发挥优势的地方。
Bagging类方法的目标是,减少模型的方差,而Boosting类方法的目标是减少模型的偏差。
Bagging类方法对于减小模型的偏差无效,因为模型过于简单而无法很好地捕捉到数据的变化趋势。
因此,需要对低偏差的分类器执行Bagging,
换句话说,Bagging类集成模型所采用的基模型最好是对样本分布比较敏感的,也就是那种不稳定的分类器。
线性分类器或者K-近邻都是比较稳定的分类器,模型本身方差就不大,因此将这类单模型作为基分类器用于Bagging,并不能
收获更好的表现。
因此,不能将随机森林中的基分类器替换为线性分类器,如逻辑回归或者K-近邻模型。
5.通过自适应提升(adaptive Boosting)来利用弱学习器
在Boosting中,个体学习器通常由非常简单的基模型组成,也被称为弱学习器。这些弱学习器通常仅有比随机猜测略好的表现。
Boosting:
从错误中学习,针对上一个分类器错分的样本。
5.1Boosting工作原理
与Bagging类方法相反,Boosting算法使用的是:
从原始训练数据中通过无放回采样,步骤归纳如下:
1.从训练样本中随机选取一个样本子集,注意是无放回的。子集记作 d 1 d_1 d1,对应的数据集为 D D D。利用该子集训练弱学习器 C 1 C_1 C1;
2.抽取第二个随机子集 d 2 d_2 d2,并将上一轮中分类器错分的样本的50%添加到当前样本子集,训练弱分类器 C 2 C_2 C2;
3.抽取样本子集 d 3 d_3 d3,在该样本子集上,分类器 C 1 C_1 C1和 C 2 C_2 C2有着不同的预测结果,使用该子集训练弱分类器 C 3 C_3 C3;
4.通过多数投票表决将弱分类器 C 1 , C 2 , C − 3 C_1, C_2, C-3 C1,C2,C−3组合起来。
AdaBoost:使用完整的训练数据集训练弱分类器,其中训练示例在每次迭代过程中重新赋予权重,从而构建一个强分类器,其针对弱分类器错分样本
进一步学习。
# AdaBoost算法几何表示
Image(filename='images/07_09.png', width=400)
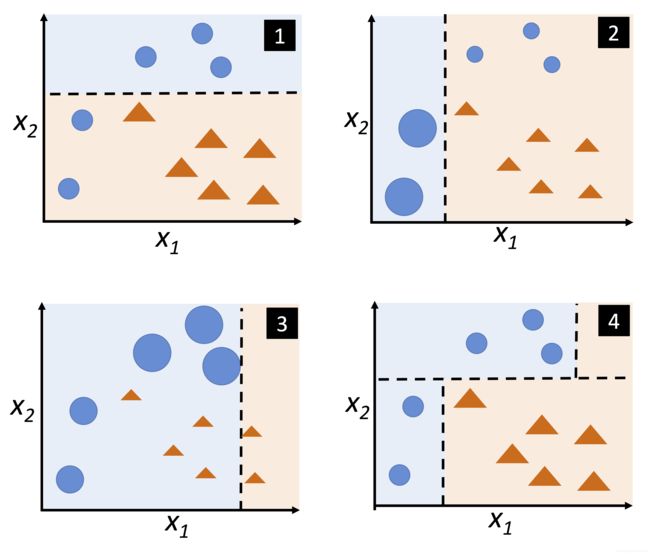
子图1,代表一个用于二分类的训练数据集,其中的训练样本都被赋予了相同的权重。基于该数据集,训练一个决策树桩—如虚线所示。
它试图对该二分类样本进行分类,并尽可能小的最小化代价函数.
下一轮,子图2中,将前一轮错误分类的两个样本(圆圈)赋予更大的权重。则下一个决策树桩会更聚焦于具有更大权重的训练样本。子图2中显示的弱学习器误分
了来自圆圈类的三个样本,然候这几个样本在子图3中被赋予更大的权重。
假设当前AdaBoost集成模型仅仅包含三轮Boosting,然后将基于不同权重得到的弱学习器以多数投票表决的形式进行组合,得到子图4.
AdaBoost算法步骤:
约定:x代表元素级别的乘法;点号代表两个向量的点积;
1.将权重向量 W \boldsymbol{W} W设定为统一的值,条件为 ∑ i w i = 1 \sum_i w_i =1 ∑iwi=1;
2.总轮数为 m m m,对第 j j j轮执行如下操作:
a.训练一个弱学习器: C j = train ( X , y , w ) C_{j}=\operatorname{train}(\boldsymbol{X}, \boldsymbol{y}, \boldsymbol{w}) Cj=train(X,y,w)
b.预测类别标签: y ^ = predict ( C j , X ) \widehat{\boldsymbol{y}}=\operatorname{predict}\left(C_{j}, \boldsymbol{X}\right) y =predict(Cj,X)
c.计算加权错误率: ε = w ⋅ ( y ^ ≠ y ) \varepsilon=\boldsymbol{w} \cdot(\widehat{\boldsymbol{y}} \neq \boldsymbol{y}) ε=w⋅(y =y)
d.计算系数: α j = 0.5 log 1 − ε ε \alpha_{j}=0.5 \log \frac{1-\boldsymbol{\varepsilon}}{\boldsymbol{\varepsilon}} αj=0.5logε1−ε
e.更新权重: w : = w × exp ( − α j × y ^ × y ) w:=w \times \exp \left(-\alpha_{j} \times \widehat{y} \times y\right) w:=w×exp(−αj×y ×y)
f.将权值归一化到1: w : = w / ∑ i w i \boldsymbol{w}:=\boldsymbol{w} / \sum_{i} w_{i} w:=w/∑iwi
3.计算最终预测结果: y ^ = ( ∑ j = 1 m ( α j × predict ( C j , X ) ) > 0 ) \widehat{\boldsymbol{y}}=\left(\sum_{j=1}^{m}\left(\boldsymbol{\alpha}_{j} \times \operatorname{predict}\left(C_{j}, \boldsymbol{X}\right)\right)>0\right) y =(∑j=1m(αj×predict(Cj,X))>0)
# 一个Adaboost算法示例
Image(filename='images/07_10.png', width=500)
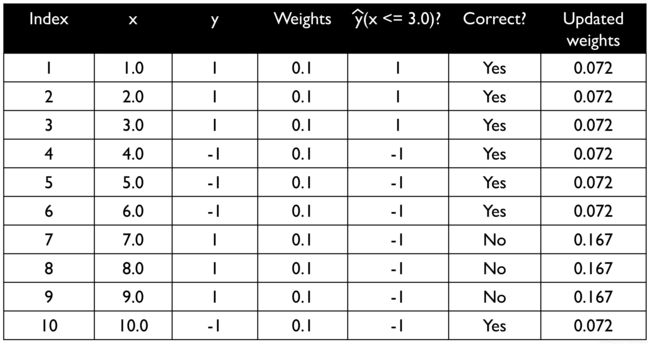
该数据为1维,类别标签分别为+1和-1;统一分配相同的初始权值,并将其归一化到1;因此对应的都为0.1;
假定分类标准为 x ≤ 3.0 x\le 3.0 x≤3.0,最后一列就是基于上述伪代码更新后的权值。
加权错误率计算过程:
ε = 0.1 × 0 + 0.1 × 0 + 0.1 × 0 + 0.1 × 0 + 0.1 × 0 + 0.1 × 0 + 0.1 × 1 + 0.1 × 1 + 0.1 × 1 + 0.1 × 0 = 3 10 = 0.3 \begin{aligned} \varepsilon=& 0.1 \times 0+0.1 \times 0+0.1 \times 0+0.1 \times 0+0.1 \times 0+0.1 \times 0 \\ &+0.1 \times 1+0.1 \times 1+0.1 \times 1+0.1 \times 0=\frac{3}{10}=0.3 \end{aligned} ε=0.1×0+0.1×0+0.1×0+0.1×0+0.1×0+0.1×0+0.1×1+0.1×1+0.1×1+0.1×0=103=0.3
计算系数 α j \alpha_j αj: 用于更新权重
α j = 0.5 log ( 1 − ε ε ) ≈ 0.424 \alpha_{j}=0.5 \log \left(\frac{1-\varepsilon}{\varepsilon}\right) \approx 0.424 αj=0.5log(ε1−ε)≈0.424
更新权重:
更新依据:
w : = w × exp ( − α j × y ^ × y ) \boldsymbol{w}:=\boldsymbol{w} \times \exp \left(-\alpha_{j} \times \widehat{\boldsymbol{y}} \times \boldsymbol{y}\right) w:=w×exp(−αj×y ×y)
这里的 y ^ × y \widehat{\boldsymbol{y}} \times \boldsymbol{y} y ×y为预测类别标签和真实标签之间元素级别的乘法;
如果预测正确,则 y ^ × y \widehat{\boldsymbol{y}} \times \boldsymbol{y} y ×y就代表需要减小相应权重,
更新示例:
0.1 × exp ( − 0.424 × 1 × 1 ) ≈ 0.065 0.1 \times \exp (-0.424 \times 1 \times 1) \approx 0.065 0.1×exp(−0.424×1×1)≈0.065
如果预测错误,则增加权重,
更新示例:
0.1 × exp ( − 0.424 × 1 × ( − 1 ) ) ≈ 0.153 0.1 \times \exp (-0.424 \times 1 \times(-1)) \approx 0.153 0.1×exp(−0.424×1×(−1))≈0.153
0.1 × exp ( − 0.424 × ( − 1 ) × ( 1 ) ) ≈ 0.153 0.1 \times \exp (-0.424 \times(-1) \times(1)) \approx 0.153 0.1×exp(−0.424×(−1)×(1))≈0.153
权重归一化: 从而所有的权重之和为1
w : = w ∑ i w i 这里 ∑ i w i = 7 × 0.065 + 3 × 0.153 = 0.914 \begin{aligned} \boldsymbol{w}:=\frac{\boldsymbol{w}}{\sum_{i} w_{i}} \\ \text { 这里 } \sum_{i} w_{i}=7 \times 0.065+3 \times 0.153=& 0.914 \end{aligned} w:=∑iwiw 这里 i∑wi=7×0.065+3×0.153=0.914
这样一来,所有被正确分类的样本权重由原来的0.1减小到了现在的0.071,即
0.065 / 0.914 ≈ 0.071 0.065 / 0.914 \approx 0.071 0.065/0.914≈0.071
错误分类的样本权重,从原来的0.1增加到了现在的0.167
0.153 / 0.914 ≈ 0.167 0.153 / 0.914 \approx 0.167 0.153/0.914≈0.167
5.2利用sklearn实现AdaBoost算法
from sklearn.ensemble import AdaBoostClassifier

tree = DecisionTreeClassifier(criterion='entropy',
                              max_depth=1,
                              random_state=1)

ada = AdaBoostClassifier(base_estimator=tree,
                         n_estimators=500,
                         learning_rate=0.1,
                         random_state=1)
tree = tree.fit(X_train, y_train)
y_train_pred = tree.predict(X_train)
y_test_pred = tree.predict(X_test)

tree_train = accuracy_score(y_train, y_train_pred)
tree_test = accuracy_score(y_test, y_test_pred)
print('Decision tree train/test accuracies %.3f/%.3f'
      % (tree_train, tree_test))

"""
这里可以看出,利用AdaBoost算法试图降低模型的偏差,但实际上又引入了额外的方差---模型在训练和测试集上具有了更大的差距
"""

ada = ada.fit(X_train, y_train)
y_train_pred = ada.predict(X_train)
y_test_pred = ada.predict(X_test)

ada_train = accuracy_score(y_train, y_train_pred)
ada_test = accuracy_score(y_test, y_test_pred)
print('AdaBoost train/test accuracies %.3f/%.3f'
      % (ada_train, ada_test))
Decision tree train/test accuracies 0.916/0.875
AdaBoost train/test accuracies 1.000/0.917
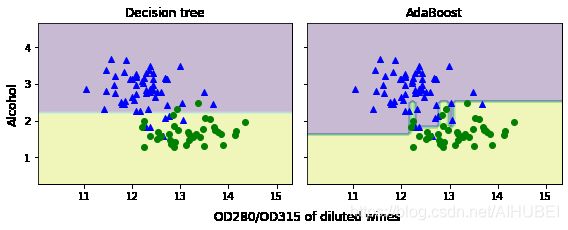
# 决策边界可视化对比
x_min, x_max = X_train[:, 0].min() - 1, X_train[:, 0].max() + 1
y_min, y_max = X_train[:, 1].min() - 1, X_train[:, 1].max() + 1
xx, yy = np.meshgrid(np.arange(x_min, x_max, 0.1),
                     np.arange(y_min, y_max, 0.1))

f, axarr = plt.subplots(1, 2, sharex='col', sharey='row', figsize=(8, 3))


for idx, clf, tt in zip([0, 1],
                        [tree, ada],
                        ['Decision tree', 'AdaBoost']):
    clf.fit(X_train, y_train)

    Z = clf.predict(np.c_[xx.ravel(), yy.ravel()])
    Z = Z.reshape(xx.shape)

    axarr[idx].contourf(xx, yy, Z, alpha=0.3)
    axarr[idx].scatter(X_train[y_train == 0, 0],
                       X_train[y_train == 0, 1],
                       c='blue', marker='^')
    axarr[idx].scatter(X_train[y_train == 1, 0],
                       X_train[y_train == 1, 1],
                       c='green', marker='o')
    axarr[idx].set_title(tt)

axarr[0].set_ylabel('Alcohol', fontsize=12)

plt.tight_layout()
plt.text(0, -0.2,
         s='OD280/OD315 of diluted wines',
         ha='center',
         va='center',
         fontsize=12,
         transform=axarr[1].transAxes)

#plt.savefig('images/07_11.png', dpi=300, bbox_inches='tight')
plt.show()
可以看出AdaBoost模型的决策边界更加复杂,这也是其引入了一定方差的原因。
5.3.梯度提升Gradient Boosting
梯度提升和AdaBoost有着相似的整体概念,即:将弱学习器提升为强学习期。
区别在于:权重更新方式和弱学习器的组合方式。
