一、背景介绍
Adventure Works Cycles是基于微软SQL Server中AdventureWorks 示例数据库所构建的虚拟公司,它是一家大型跨国制造公司。该公司向北美,欧洲和亚洲商业市场生产并销售金属和复合材料自行车。尽管其基本业务位于华盛顿州的博塞尔市,拥有290名员工,但几个区域销售团队遍布整个市场。
2000年,Adventure Works Cycles收购了一家位于墨西哥的小型制造工厂Importadores Neptuno。Importadores Neptuno为Adventure Works Cycles产品系列制造了几个关键子组件。这些子组件被运送到Bothell位置进行最终产品组装。2001年,Importadores Neptuno成为旅游自行车产品集团的唯一制造商和分销商。
在成功实现财政年度之后,Adventure Works Cycles希望通过下面三种方式扩大销售额,第一销售目标定位到最佳客户、第二通过外部网站扩展适用的产品、第三通过降低生产成本来降低销售成本。
其中关于客户类型、产品介绍、采购和供应商这三个方面来做一个简单的介绍
客户类型
Adventure Works Cycle的客户主要有两种:
个体:通过网上零售店铺来购买商品
商户: 从Adventure Works Cycles销售代表处购买转售产品的零售店或批发店。
产品介绍
作为一家自行车生产公司,Adventure公司主要有以下四条产品线:
Adventure Works Cycles 生产的自行车
自行车部件,例如车轮,踏板或制动组件
从供应商处购买的自行车服装,用于转售给Adventure Works Cycles的客户。
从供应商处购买的自行车配件,用于转售给Adventure Works Cycles客户。
采购和供应商方面
在Adventure Works Cycles,采购部门购买用于制造Adventure Works Cycles自行车的原材料和零件。 Adventure Works Cycles还购买转售产品,如自行车服装和自行车附加装置,如水瓶和水泵。
Adventure数据库简介
二、项目流程
1、在Hive数据库中建表并导入数据
2、探索数据库,罗列指标,了解数据库中各个表格的构成及相互间的关系
3、汇总数据,建立数据仓库
4、连接至Power BI进行可视化展示
三、数据导入
1、转换csv文件
解压Adventure数据库后,我们得到了29个csv文件以及一个导出建表语句的sql文件。csv文件都以“|”作为分隔符,而hive默认用逗号作为分隔符,需要对其进行调整。
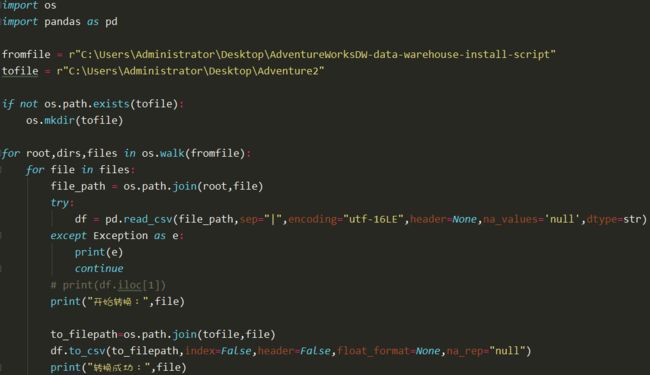
用遍历文件的方法加上pandas库,对文件进行转换操作
1)用os.walk获取文件名,建立for循环,
2)用pd.read_csv来读取文件,同时设置好分隔符和编码格式
3)用os.path.join将文件名和文件路径合并在一起以供调用,df.to_csv输出转换后的csv文件
2、读取文件
利用python的正则表达式来循环读取文件,同时获取表名和字段名
create_file=open(r"create_table.sql")

table_info = {}
# 循环读取文件,获取表名和字段名
content=create_file.readline()
while len(content)!=0:
    # print(content,end="")
    # 如果是有 create table
    table_name = ''
    table_columns = []
    while "GO" not in content:
        # print(content,end="")
        if "CREATE TABLE" in content.upper():
            # 正则表达式,获取表名
            se0bj = re.search(r"\[(.*?)\].\[(.*?)\]",content,re.I)  # re.I 对大小写不敏感;(.*?)用于分组
            if se0bj:
                table_name = se0bj.group(2)
        matOjb = re.search(r"\[(.*?)\] \[(.*?)\].*",content.lstrip(),re.I)  #  读取字段名和字段类型
        if matOjb:
            column = matOjb.group(1)
            if column.upper() == "DATE":
                column = "date_time"
            type = matOjb.group(2)
            table_columns.append([column,type])
        content = create_file.readline()
    table_info[table_name]=table_columns

    print(table_name)
    print(table_columns)

    content=create_file.readline()

create_file.close()
3、生成建表脚本
用字段结果生成建表shell脚本
# 解析 table_info 字典,用来创建表
shell_file = open(r"create_table.sh","w")
shell_file.writelines("#!/bin/sh\n\nhive -v -e\"\nuse adventure_ods_qtfy;\n\n")
for key in table_info.keys():

    # 先写入表头
    # shell_file.writelines("drop table " + key + ";\n")
    shell_file.write("create table if not exists  " + key + "(\n")

    for columns in table_info[key]:
        if columns == table_info[key][len(table_info[key])-1]:
            shell_file.write("  " + columns[0] + "      string\n")
        else:
            shell_file.write("  "+columns[0]+"      string,\n")

    # 写入建表格式
    shell_file.write(""")row format serde 'org.apache.hadoop.hive.serde2.lazy.LazySimpleSerDe'
    with serdeproperties(
    'field.delim'=',',
    'serialization.encoding'='UTF-8')
    stored as textfile;\n\n""")

shell_file.write("\";")
shell_file.close()
4、生成导数shell文件
# 导入数据语句
load_file = open("load_create_data.sh","w")
load_file.writelines("#!/bin/sh\n\nhive -v -e\"\nuse adventure_ods_qtfy;\n\n")

for key in table_info.keys():
    load_file.write("load data local inpath \'/root/qtfy/ods_datas/%s.csv\' overwrite into table %s;\n"%(key,key))


load_file.write("\n\";")
load_file.close()
5、建库并导数
登录linux云服务器,进入hive环境,新建ods层数据库,用于存放基础数据
上传csv文件至云服务器,然后执行shell文件,从上传的csv文件中导出数据到hive环境下ods层数据库中
四、数据探索
1、了解数据
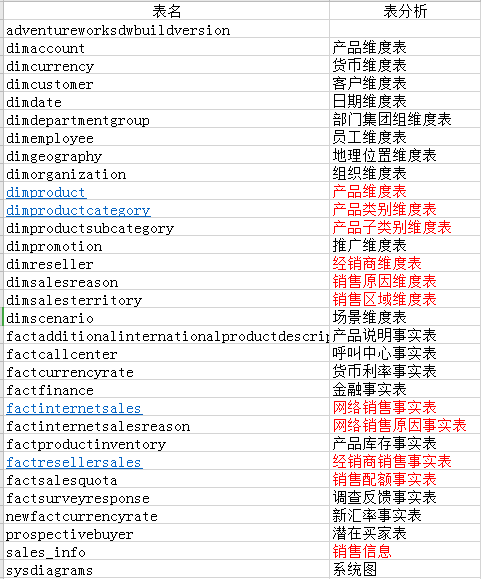
29个表格名称如图所示
此处我们暂以销售为主题进行探索
表格分为维度表(以dim开头)和事实表(以fact开头)两类,表格设计结构为星座模型。
维度表:表示对分析主题所属类型的描述。比如产品维度表中有产品id、子类别id、名称、产地、价格等属性,如果别的表有产品id,就可以通过join连接来获得相应其他字段,节约表的空间。
事实表:表示对分析主题的度量。比如淘宝用户每日下单的记录,买家可获得其汇总信息,包括有userid、订单号、支付时间、支付链接等等
2、目的及问题
1)对数据仓库的数据进行可视化界面的加工,方便数据的查看;
2)以销售情况为主题观察数据的基本情况;
3)搭建指标框架结构,设计可视化图表布局;
3、数据指标整理
此次分析以销售为主题,因此重点放在销售的表格
事实表:
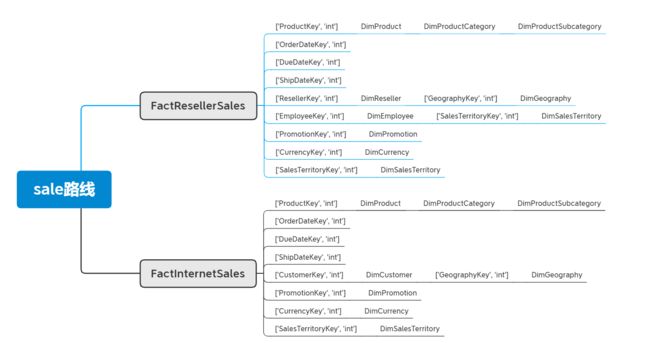
FactResellerSales和FactInternetSales两张表,除了FactInternetSales中多了EmployeeKey字段外,其他字段两张表均保持一致;
维度表:
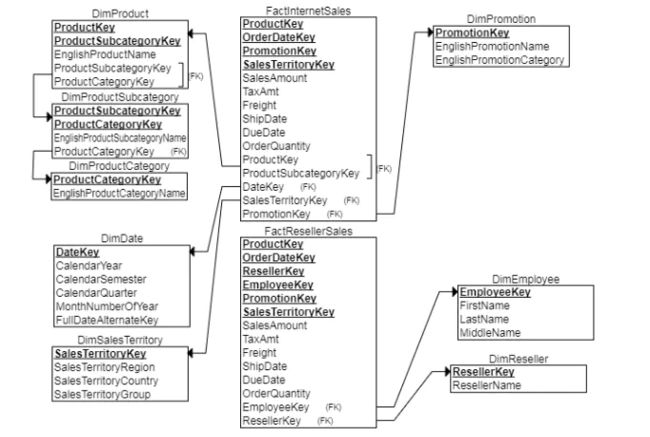
事实表中存在的key有:ProductKey,OrderDateKey,PromotionKey, SalesTerritoryKey等;
ER关系图如下:
维度:
产品维度:产品分类、产品子分类
时间维度:年、季、月
地区维度:销售地区
推广维度:推广方式
可分析的指标:
1.总销售额=销售量 * 客单价
2.总成本=产品标准成本 * 销售量+每笔订单的税费+运费
3.利润情况=销售额-总成本
4.销售指标达成情况
5.销售量最佳的产品Top10
6.各维度下搭配,如时间维度下的销售情况、销售区域变化情况
地区维度下的销售额、推广情况
产品分类下的销售情况
五、相应SQL语句
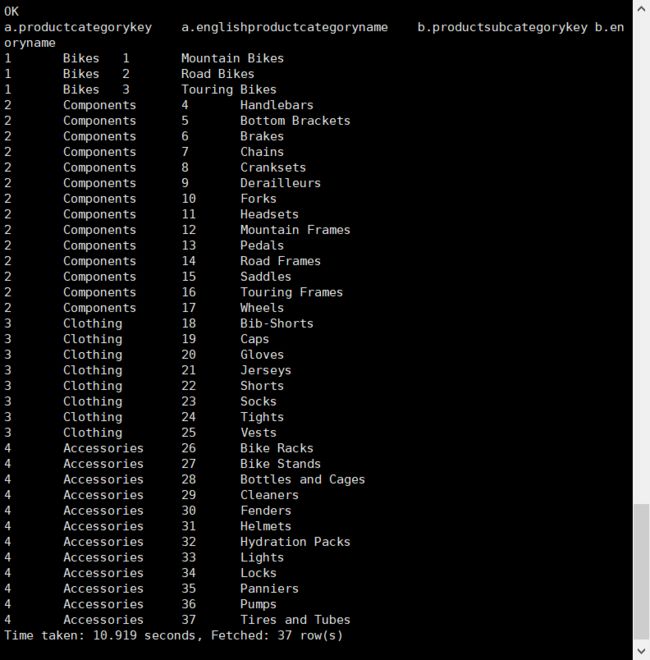
1、找出产品主类和子品类的对应关系,并且观察消费者的青睐程度
select a.ProductCategoryKey, a.EnglishProductCategoryName,
  b.ProductSubcategoryKey, b.EnglishProductSubcategoryName
from DimProductCategory a join DimProductSubcategory b
on a.ProductcategoryKey=b.ProductCategoryKey;
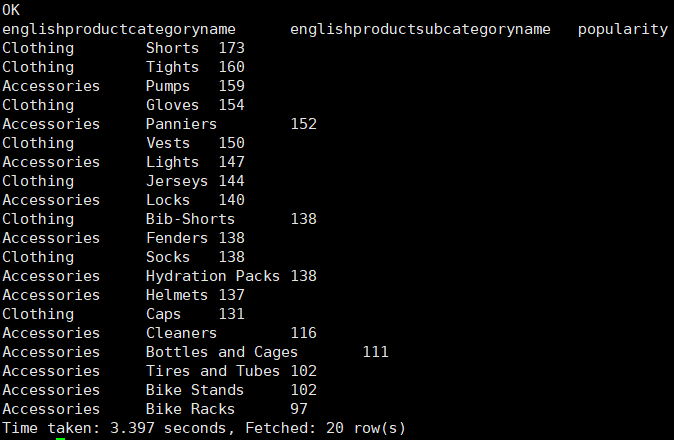
2、受欢迎程度
a、最受消费者欢迎(购买的顾客最多)的产品主类排序
Select  EnglishProductCategoryName, count(CustomerKey) as Popularity
From FactSurveyResponse
Group by EnglishProductCategoryName
Order by Popularity desc;
b、最受消费者欢迎的产品子类排序
Select  EnglishProductCategoryName, EnglishProductSubcategoryName, count(CustomerKey) as Popularity
From FactSurveyResponse
Group by EnglishProductCategoryName, EnglishProductSubcategoryName
Order by Popularity desc;
3、各大品类的销售情况
select
   case when b.ProductSubcategoryKey between 1 and 3 then 'Bikes'
                        when b.ProductSubcategoryKey between 4 and 17 then 'Components'
                        when b.ProductSubcategoryKey between 18 and 25 then 'Clothing'
                        when b.ProductSubcategoryKey between 26 and 37 then 'Accessories'
                        else 'errors' end  as product_catory,
   sum(a.SalesAmount) as cloth_sales
from FactInternetSales a
inner join dimproduct b
on a.ProductKey=b.productkey
group by case when b.ProductSubcategoryKey between 1 and 3 then 'Bikes'
                        when b.ProductSubcategoryKey between 4 and 17 then 'Components'
                        when b.ProductSubcategoryKey between 18 and 25 then 'Clothing'
                        when b.ProductSubcategoryKey between 26 and 37 then 'Accessories'
                        else 'errors' end ;
4、建立汇总表
数据仓库一般可分为ods基础层和dm汇总层,我们已经在ods层导入存放了基础数据,现在需要在dm层汇总我们想要分析的数据
先新建一个dm层数据库
1)聚合产品表
可以发现DimProductCategory以及DimProductSubcategory这两张产品种类维度的表格同时存在 ['ProductCategoryKey', 'int']字段,对这两张表格进行连接,可以得到产品的主分类和子分类的情况,同时可以得到产品种类英文名
create table if not exists adventure_dw_qtfy.dimproductsubcategory_new as
    select b.ProductSubcategoryKey, a.EnglishProductCategoryName, b.EnglishProductSubcategoryName
from DimProductCategory a join DimProductSubcategory b
on a.ProductcategoryKey=b.ProductCategoryKey;
2)为了方便查阅,将ods层部分表格迁移过来
use adventure_dw_qtfy;
# 销售地区维度表
drop table if exists dimsalesterritory;
create table dimsalesterritory as select * from adventure_ods_qtfy.dimsalesterritory;

# 产品维度表
drop table if exists DimProduct;
create table DimProduct as select * from adventure_ods_qtfy.DimProduct;
3)建立事实表fact_time
create table fact_time as
SELECT
  a.*,
  b.amount       AS amount_last_year,
  b.order_number AS order_number_last_year,
  c.amount       AS amount_last_month,
  c.order_number AS order_number_last_month,
  round(((a.amount-c.amount)/c.amount)*100,2)                   AS amount_comp_last_month,
  round(((a.order_number-c.order_number)/c.order_number)*100,2) AS order_number_comp_last_month,
  round(((a.amount-b.amount)/b.amount)*100,2)                   AS amount_comp_last_year,
  round(((a.order_number-b.order_number)/b.order_number)*100,2) AS order_number_comp_last_year
FROM  (
  SELECT
    SalesTerritoryKey,
    concat_ws('-',substr(orderdatekey,0,4),substr(orderdatekey,5,2),substr(orderdatekey,7,2)) AS orderdate,
    YEAR(concat_ws('-',substr(orderdatekey,0,4),substr(orderdatekey,5,2),substr(orderdatekey,7,2)))         AS time_YEAR,
    QUARTER(concat_ws('-',substr(orderdatekey,0,4),substr(orderdatekey,5,2),substr(orderdatekey,7,2)))      AS time_QUARTER,
    MONTH(concat_ws('-',substr(orderdatekey,0,4),substr(orderdatekey,5,2),substr(orderdatekey,7,2)))        AS time_MONTH,
    WEEKofyear(concat_ws('-',substr(orderdatekey,0,4),substr(orderdatekey,5,2),substr(orderdatekey,7,2)))   AS time_WEEK,
    count( SalesAmount )                          AS order_number,
    round(count(SalesAmount)*(0.9+rand ()*0.4),2) AS order_number_forcost,
    round( sum( SalesAmount ), 2 )                AS amount,
    round(sum(SalesAmount)*(0.9+rand ()*0.4),2)   AS amount_forcost,
    round(sum(SalesAmount)/count(SalesAmount),2)  AS customerunitprice,
    round( avg( TotalProductCost ), 2 )           AS per_productcost,
    round( avg( TaxAmt ), 2 )                     AS per_tax,
    round( avg( freight ), 2 )                    AS avg_freight
  FROM
    adventure_ods_qtfy.FactInternetSales
  GROUP BY
    SalesTerritoryKey,
    OrderDateKey
  ) a
  LEFT JOIN (
    SELECT
      SalesTerritoryKey,
      OrderDateKey,
      date_add(concat_ws('-',substr(orderdatekey,0,4),substr(orderdatekey,5,2),substr(orderdatekey,7,2)), 365 ) AS orderdate,
      count( SalesAmount )            AS order_number,
      round( sum( SalesAmount ), 2 )  AS amount
    FROM
      adventure_ods_qtfy.FactInternetSales
    GROUP BY
      SalesTerritoryKey,
      OrderDateKey
  ) b
ON a.SalesTerritoryKey = b.SalesTerritoryKey   AND a.orderdate = b.orderdate
LEFT JOIN (
    SELECT
      SalesTerritoryKey,
      OrderDateKey,
      date_add(concat_ws('-',substr(orderdatekey,0,4),substr(orderdatekey,5,2),substr(orderdatekey,7,2)),30) AS orderdate,
      count( SalesAmount ) AS order_number,
      round( sum( SalesAmount ), 2 ) AS amount
    FROM
      adventure_ods_qtfy.FactInternetSales
    GROUP BY
      SalesTerritoryKey,
      OrderDateKey
  ) c
ON b.SalesTerritoryKey = c.SalesTerritoryKey AND b.orderdate = c.orderdate
WHERE
  a.orderdate <= current_date()
ORDER BY
  a.SalesTerritoryKey, a.orderdate;
4)建立事实表Factinternet
create table Factinternet
as
select a.*,round(a.order_number/a.order_number_forcost,2) as order_number_forcost_comp,
       round(a.order_number/a.order_number_forcost,2) as amount_forcost_comp
from (
SELECT
    a.OrderDatekey as orderdate,
    YEAR(concat_ws('-',substr(orderdatekey,0,4),substr(orderdatekey,5,2),substr(orderdatekey,7,2)))       AS time_YEAR,
    QUARTER(concat_ws('-',substr(orderdatekey,0,4),substr(orderdatekey,5,2),substr(orderdatekey,7,2)))    AS time_QUARTER,
    MONTH(concat_ws('-',substr(orderdatekey,0,4),substr(orderdatekey,5,2),substr(orderdatekey,7,2)))      AS time_MONTH,
    WEEKofyear(concat_ws('-',substr(orderdatekey,0,4),substr(orderdatekey,5,2),substr(orderdatekey,7,2))) AS time_WEEK,
    a.SalesTerritoryKey,
    b.ProductSubcategoryKey,
    count(a.CustomerKey) AS order_number,
    round(count(a.CustomerKey)* (0.9+rand ( ) * 0.4), 2) AS order_number_forcost,
    round(sum( a.SalesAmount ), 2) AS Amount,
    round(sum(SalesAmount)*(0.9+rand ()*0.4),2) AS amount_forcost,
    round(sum(a.SalesAmount)/count(a.SalesAmount),2) AS customerunitprice,
    round(avg(a.TotalProductCost), 2) AS per_productcost,
    round(avg(a.TaxAmt), 2) AS per_tax,
    round(avg(a.freight), 2) AS avg_freight
FROM
    adventure_ods_qtfy.FactinternetSales a
LEFT JOIN adventure_ods_qtfy.DimProduct b ON a.ProductKey = b.ProductKey
where concat_ws('-',substr(orderdatekey,0,4),substr(orderdatekey,5,2),substr(orderdatekey,7,2)) <= current_date()
GROUP BY
    a.OrderDatekey,
    a.SalesTerritoryKey,
    b.ProductSubcategoryKey) a;
5)建立事实表fact_geography
create table fact_geography as
select
    b.GeographyKey,
    sum(a.SalesAmount) as amount,
    count(a.CustomerKey) as order_number
from FactInternetSales a
left join DimCustomer b on a.CustomerKey=b.CustomerKey
GROUP BY b.GeographyKey;
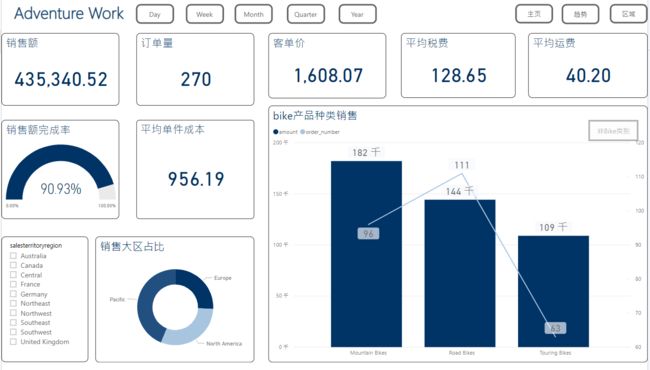
六、Power BI可视化展示
Power BI报表展示链接
