python深度学习入门-神经网络的学习
深度学习入门-神经网络的学习
博主微信公众号(左)、Python+智能大数据+AI学习交流群(右):欢迎关注和加群,大家一起学习交流,共同进步!
![]()
![]()
目录
摘要
1、从数据中学习
1.1 数据驱动
1.2 训练数据和测试数据
2、 损失函数
2.1 均方误差
2.2 交叉熵误差
2.3 mini-batch 学习
2.4 mini-batch 版交叉熵误差的实现
2.5 为何要设定损失函数
3、数值微分
3.1 导数
3.2 数值微分的例子
3.3 偏导数
4、梯度
4.1 梯度法
4.2 神经网络的梯度
5、学习算法的实现
5.1 实现手写数字识别的神经网络
摘要
- 机器学习中使用的数据集分为训练数据和测试数据。
- 神经网络中用训练数据进行学习,并用测试数据评价学习到的模型的泛化能力。
- 神经网络的学习以损失函数为指标,更新权重参数,以使损失函数的值减小。
- 利用某个给定的微小值的差分求导数的过程,称为数值微分。
- 利用数值微分,可以计算权重参数的梯度。
- 数值微分虽然浪费时间,但是实现起来很简单。
1、从数据中学习
神经网络的特征:从数据中学习。
从数据中学习:可以由数据自动决定权重参数的值。
1.1 数据驱动
如何实现手写数字 “5” 的识别?
方案一:人工想到的算法。
方案二:先从图像中提取特征量,再用机器学习技术学习这些特征的模式。
特征量:可以从输入数据(输入图像)中准确地提取本质数据(重要的数据)的转换器。
图像的特征量通常表示为向量的形式。在计算机视觉领域,常用的特征量包括 SIFT、SURF 和 HOG 等。使用这些特征量将图像转换为向量,然后对转换后的向量使用机器学习中的 SVM、KNN 等分类器进行学习。
注意:将图像转换为向量时使用的特征量仍是由人设计的(针对不同的问题人工考虑设计合适的特征量)。对于不同的问题,必须使用合适的特征量(必须设计专门的特征量),才能得到好的结果。比如,为了区分狗的脸部,人们需要考虑与用于识别数字 5 的特征量不同的其他特征量。
方案三:神经网络直接学习图像本身。
神经网络的优点:对所有的问题都可以用相同的流程来解决(与待处理的问题无关,神经网络可以将数据直接作为原始数据,进行 “端到端” 的学习)。比如,不管要求解的问题是识别 5,还是识别狗,抑或是识别人脸,神经网络都是通过不断地学习所提供的数据,尝试发现待求解的问题的模式。
端到端机器学习(end-to-end machine learning):从一端到另一端,从原始数据(输入)中获得目标结果(输出)。
1.2 训练数据和测试数据
机器学习中,一般将数据分为训练数据(监督数据)和测试数据两部分来进行学习和实验等。首先,使用训练数据进行学习,寻找最优的参数;然后,使用测试数据评价训练得到的模型的实际能力。
为什么需要将数据分为训练数据和测试数据?答:因为我们追求的是模型的泛化能力。为了正确评价模型的泛化能力,就必须划分训练数据和测试数据。
泛化能力:处理未被观察过的数据(不包含在训练数据中的数据)的能力。获得泛化能力是机器学习的最终目标。比如,在识别手写数字的问题中,泛化能力可能会被用在自动读取明信片的邮政编码的系统上。
过拟合(voer fitting):可以顺利的处理某个数据集,但无法处理其他数据集的情况(只对某个数据集过度拟合的状态)。
2、 损失函数
神经网络的学习通过某个指标表示现在的状态,然后,以这个指标为基准,寻找最优权重参数。
损失函数(loss function):神经网络的学习中所用的指标称为损失函数(loss function)(表示神经网络性能的 “恶劣程度” 的指标,即当前的神经网络对监督数据在多大程度上不拟合,在多大程度上不一致)。这个损失函数可以使用任意函数,但一般用均方误差、交叉熵等。
2.1 均方误差
均方误差(mean squared error)如下式所示。
![]() :神经网络的输出;
:神经网络的输出;![]() :训练数据的标签值(one-hot 表示);
:训练数据的标签值(one-hot 表示);![]() :数据的维度。
:数据的维度。
ont-hot 表示:将正确解标签表示为 1,其他标签表示为 0 的表示方法称为 one-hot 表示。
示例:手写数字识别
数组元素的索引从第一个开始一次对应数字 "0" "1" "2" "3" "4" "5" "6" "7" "8" "9"。这里,神经网络的的输出 y是 softmax 函数的输出。
"0" 的概率是0.1; "1" 的概率是0.05; "2" 的概率是0.6; "3" 的概率是0.0;
"4" 的概率是0.05; "5" 的概率是0.1; "6" 的概率是0.0; "7" 的概率是0.1;
"8" 的概率是0.0; "9" 的概率是0.0;
将正确解标签设为 1,其他均设为 0。这里标签 "2" 为 1,表示正确解是 "2"。
>>> y = [0.1, 0.05, 0.6, 0.0, 0.05, 0.1, 0.0, 0.1, 0.0, 0.0]
>>> t = [0, 0, 1, 0, 0, 0, 0, 0, 0, 0]
示例代码:均方误差会计算神经网络的输出和正确解训练数据的各个元素之间的平方,再求总和。
"""
均方误差
"""
import numpy as np


def mean_squared_error(y, x):
    """
    均方误差
    :param y: 神经网络输出
    :param x: 训练数据
    :return:
    """
    return 0.5 * np.sum((y - x) ** 2)


# 设 "2" 为正确解
t = [0, 0, 1, 0, 0, 0, 0, 0, 0, 0]
# 例1:"2" 的概率最高的情况(0.6)
y = [0.1, 0.05, 0.6, 0.0, 0.05, 0.1, 0.0, 0.1, 0.0, 0.0]
loss = mean_squared_error(np.array(y), np.array(t))
print(f"loss1: {loss}")

# 例2:"7" 的概率最高的情况(0.6)
y = [0.1, 0.05, 0.1, 0.0, 0.05, 0.1, 0.0, 0.6, 0.0, 0.0]
loss = mean_squared_error(np.array(y), np.array(t))
print(f"loss2: {loss}")
loss1: 0.09750000000000003
loss2: 0.5975例 1 中:正确解是 "2",神经网络的输出的最大值是 "2"。损失函数的值较小,和训练数据之间的误差较小。
例 2 中:正确解是 "2",神经网络的输出的最大值是 "7"。损失函数的值较大,和训练数据之间的误差较大。
2.2 交叉熵误差
(1)交叉熵误差(cross entropy error)如下式所示。
![]() :神经网络的输出;
:神经网络的输出;
![]() :训练数据的标签值(只有正确解标签的索引为1,其他均为 0 (one-hot 表示));
:训练数据的标签值(只有正确解标签的索引为1,其他均为 0 (one-hot 表示));
![]() :数据的维度
:数据的维度
![]() :以
:以 ![]() 为底数的自然对数(
为底数的自然对数(![]() )。
)。
比如,假设正确解标签是 "2",与之对应的神经网络的输出是 0.6,则交叉熵误差是 ![]() ;若 "2" 对应的神经网络的输出是 0.1,则交叉熵误差是
;若 "2" 对应的神经网络的输出是 0.1,则交叉熵误差是 ![]() 。
。
注意:交叉熵误差的值是由正确解标签所对应的输出结果决定的。
(2)自然对数的图像如图 3-3 所示。
"""
自然对数图像
"""

import numpy as np
from matplotlib import pyplot as plt

x = np.arange(-5, 5, 0.01)
y = np.log(x)

plt.plot(x, y)  # 绘制图像
plt.title("function y=log(x)", fontsize=24)  # 设置title
plt.xlabel("X", fontsize=14)    # 给横轴添加标签
plt.ylabel("Y", fontsize=14)    # 给纵轴添加标签
plt.tick_params(axis="both", labelsize=14)   # 设置刻度标记的大小
plt.show() # 显示图像如图 3-3 所示,x=1 时,y 为 0;随着 x 向 0 靠近,y 逐渐变小。因此,得出如下结论:
a、正确解标签对应的输出越大,式 (3.2) 的值越接近 0;
b、当输出为 1 时,交叉熵误差为 0;
c、如果正确解标签对应的输出较小,则式 (3.2) 的值较大。
(3)代码实现交叉熵误差:
"""
交叉熵误差
"""
import numpy as np


def cross_entropy_error(y, x):
    delta = 1e-7
    return -np.sum(x * np.log(y + delta))


# 设 "2" 为正确解
x = [0, 0, 1, 0, 0, 0, 0, 0, 0, 0]
# 例1:"2" 的概率最高的情况(0.6)
y = [0.1, 0.05, 0.6, 0.0, 0.05, 0.1, 0.0, 0.1, 0.0, 0.0]
loss = cross_entropy_error(np.array(y), np.array(x))
print(f"loss1: {loss}")

# 例2:"7" 的概率最高的情况(0.6)
y = [0.1, 0.05, 0.1, 0.0, 0.05, 0.1, 0.0, 0.6, 0.0, 0.0]
loss = cross_entropy_error(np.array(y), np.array(x))
print(f"loss2: {loss}")
loss1: 0.510825457099338
loss2: 2.302584092994546例 1 中:正确解是 "2",神经网络的输出为 0.6,交叉熵误差大约为 0.51。交叉熵误差的值较小,和训练数据之间的误差较小。
例 2 中:正确解是 "2",神经网络的输出为 0.1,交叉熵误差大约为 2.30。交叉熵误差的值较大,和训练数据之间的误差较大。
2.3 mini-batch 学习
机器学习使用训练数据进行学习。使用训练数据进行学习,严格来说,就是针对训练数据计算损失函数的值,找出使该值尽可能小的参数。因此,计算损失函数时必须将所有的训练数据作为对象。也就是说,如果训练数据有 100 个的话,我们就要把这 100 个损失函数的总和作为学习的指标。
(1)假设数据有 N 个,以交叉熵损失函数为例,求所有训练数据的损失函数的总和,可以写成下面的式 (3.3)。
![]() :第 n 个数据的第 k 个元素的标签值(只有正确解标签的索引为1,其他均为 0 (one-hot 表示));
:第 n 个数据的第 k 个元素的标签值(只有正确解标签的索引为1,其他均为 0 (one-hot 表示));
![]() :神经网络的输出;
:神经网络的输出;
![]() :数据个数;
:数据个数;
![]() :数据的维度;
:数据的维度;
![]() :以
:以 ![]() 为底数的自然对数(
为底数的自然对数(![]() )。
)。
为什么要除以 N 呢?
答:通过除以 N,可以求单个数据的 “平均损失函数”。通过这样的平均化,可以获得和训练数据的数量无关的统一指标。比如,即便训练数据有 1000 个或 10000 个,也可以求得单个数据的平均损失函数。
(2)mini-batch 学习
mini-batch 学习:从训练数据中选出一批数据(称为 mini-batch,小批量),然后针对每个 mini-batch 进行学习。这样的学习方式称为 mini-batch 学习。比如,从 60000 个训练数据中随机选择 100 个,再用这 100 个数据进行学习。
为什么要使用 mini-batch 学习方式?
答:以 MNIST 数据集为例,训练数据有 60000个,如果以全部数据为对象求损失函数的和,则计算过程需要花费较长的时间。再者,如果遇到大数据,数据量会有几百万、几千万之多,这种情况下以全部数据为对象计算损失函数是不现实的。因此,我们从全部数据中选出一部分,作为全部数据的 “近似”。
(3)从训练数据中随机选择指定个数的数据代码实现
"""
从训练数据中随机选择指定个数的数据
"""

import os, sys
import numpy as np

sys.path.append(os.pardir)
from dataset.mnist import load_mnist

# 数据加载
# normalize=True:将图像的像素值正规化为0.0~1.0的值
# one_hot_label=True:得到one-hot表示(仅正确解标签为1,其余为0的数据结构)
(x_train, y_train), (x_test, y_test) = load_mnist(normalize=True, one_hot_label=True)

print(f"x_train shape: {x_train.shape}")    # (60000, 784)
print(f"y_train shape: {y_train.shape}")    # (60000, 10)

# 从训练集中随机抽取10个样本
train_size = x_train.shape[0]
batch_size = 10
batch_mask = np.random.choice(train_size, batch_size)   # 从指定的数字中随机选择想要的数字
x_batch = x_train[batch_mask]
y_batch = y_train[batch_mask]

print(f"x_batch shape: {x_batch.shape}")    # (10, 784)
print(f"y_batch shape: {y_batch.shape}")    # (10, 10)
2.4 mini-batch 版交叉熵误差的实现
"""
mini-batch 版交叉熵误差
"""
import numpy as np


def cross_entropy_error(y, t):
    """
    mini-batch 版交叉熵误差,可以同时处理单个数据和批量数据
    :param y: 神经网络输出
    :param t: 训练数据标签值(one-hot形式)
    :return: 交叉熵误差
    """
    delta = 1e-7
    # y的维度为1维时,即求单个数据的交叉熵误差时,需要改变数据的形状
    if y.ndim == 1:
        t = t.reshape(1, t.size)
        y = y.reshape(1, y.size)

    batch_size = y.shape[0]
    # 除以batch_size:用 bach 的个数进行正规化
    return -np.sum(t * np.log(y + delta)) / batch_size


def cross_entropy_error_label(y, t):
    """
    mini-batch 版交叉熵误差,可以同时处理单个数据和批量数据
    :param y: 神经网络输出
    :param t: 训练数据标签值(标签形式)
    :return: 交叉熵误差
    """
    delta = 1e-7
    # y的维度为1维时,即求单个数据的交叉熵误差时,需要改变数据的形状
    if y.ndim == 1:
        t = t.reshape(1, t.size)
        y = y.reshape(1, y.size)

    batch_size = y.shape[0]
    # 除以batch_size:用 bach 的个数进行正规化
    return -np.sum(np.log(y[np.arange(batch_size), t] + delta)) / batch_size


# 设 "2" 为正确解
t = [0, 0, 1, 0, 0, 0, 0, 0, 0, 0]
# 例1:"2" 的概率最高的情况(0.6)
y = [0.1, 0.05, 0.6, 0.0, 0.05, 0.1, 0.0, 0.1, 0.0, 0.0]
loss = cross_entropy_error(np.array(y), np.array(t))
print(f"loss1: {loss}")

# 例2:"7" 的概率最高的情况(0.6)
y = [0.1, 0.05, 0.1, 0.0, 0.05, 0.1, 0.0, 0.6, 0.0, 0.0]
loss = cross_entropy_error(np.array(y), np.array(t))
print(f"loss2: {loss}")

# 例3:t为标签形式
t = [0, 1, 2, 3, 4, 5, 6, 7, 8, 9]
y = [0.1, 0.05, 0.6, 0.0, 0.05, 0.1, 0.0, 0.1, 0.0, 0.0]
loss = cross_entropy_error_label(np.array(y), np.array(t))
print(f"loss3: {loss}")
loss1: 0.510825457099338
loss2: 2.302584092994546
loss3: 77.882420887028252.5 为何要设定损失函数
(1)在神经网络的学习中,寻找最优参数(权重和偏置)时,要寻找使得损失函数的值尽可能小的参数。为了找到使损失函数的值尽可能小的地方,需要计算权重参数的损失函数的导数(梯度),然后以这个导数为指引,逐步更新参数的值。
对该权重参数的损失函数求导:表示的是 “如果稍微改变这个权重参数的值,损失函数的值会如何变化”。
a、如果导数的值为负,通过使该权重参数向正方向改变,可以减小损失函数的值;
b、如果导数的值为正,通过使该权重参数向负方向改变,可以减小损失函数的值;
c、当导数为 0 时,无论权重参数向哪个方向变化,损失函数的值都不会改变。
(2)为什么要导入损失函数,而不使用识别精度作为指标呢?
答:因为如果以识别精度作为指标,则参数的导数在绝大多数地方都会变为0。
(3)为什么用识别精度作为指标时,参数的导数在绝大多数地方都会变为0?
答:识别精度对微小的参数变化基本上没有什么反应,即便有反应,它的值也是不连续地、突然地变化。
举个例子:
a、假设神经网络正确识别出了 100 个训练数据样本中的 32 个样本,此时识别精度为 32%;
b、如果以识别精度为指标,即使稍微改变权重参数的值,识别精度也仍将保持在 32%,不会发生变化(仅仅微调参数,是无法改善识别精度的);
c、即便识别精度有多改善,它的值也不会像 32.0.123...% 这样连续变化,而是变为 33%、34% 这样的不连续的、离散的值;
d、而如果把损失函数作为指标,则当前损失函数的值可以表示为 0.92543... 这样的值。并且,如果稍微改变一下参数的值,对应的损失函数也会像 0.93432... 这样发生连续性的变化。
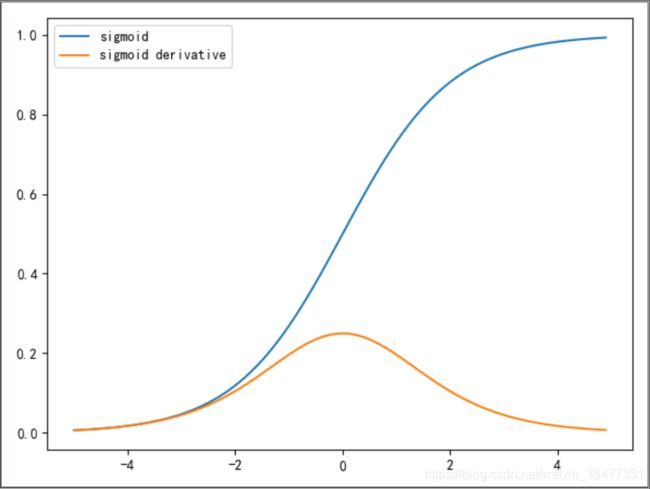
(4)阶跃函数和 sigmoid 函数:阶跃函数的斜率在绝大多数地方都为 0,sigmoid 函数的斜率(切线)不为0。
 图 3-4 阶跃函数及其导数图像
 图 3-5 sigmoid函数及其导数图像
3、数值微分
梯度法使用梯度的信息决定前进的方向。
3.1 导数
(1)导数:表示某个瞬间的变化量。它可以定义成下面的式子(函数的导数)。
![]()
![]() :
:![]() 关于
关于 ![]() 的导数,即
的导数,即 ![]() 相对于
相对于 ![]() 的变化程度。
的变化程度。
式 (3.4) 表示的导数的含义是:![]() 的 “微小变化” 将导数函数
的 “微小变化” 将导数函数 ![]() 的值在多大程度上发生变化。其中,表示微小变化的
的值在多大程度上发生变化。其中,表示微小变化的 ![]() 无限接近 0,表示为
无限接近 0,表示为 ![]() 。
。
python代码实现函数的导数:
>>> def numerical_diff(f, x):
...     h = 10e-50
...     return (f(x+h) - f(x)) / h
函数 numerical_diff(f, x) 的名称来源于数值微分的英文 numerical differentiation。这个函数有两个参数,即 “函数f” 和 “传给函数 f 的参数 x”。
(2)式 (3.4) 中函数的导数公式缺陷:
a、在上面的实现中,因为想把尽可能小的值赋给 ![]() (可以的话,想让
(可以的话,想让 ![]() 无限接近 0),所以
无限接近 0),所以 ![]() 使用了 10e-50 这个微小值。但是,这样反而产生了舍入误差(rounding error)。
使用了 10e-50 这个微小值。但是,这样反而产生了舍入误差(rounding error)。
b、函数真实的导数对应的是函数在 ![]() 处的斜率(称为切线),但式 (3.4) 中计算的导数对应的是
处的斜率(称为切线),但式 (3.4) 中计算的导数对应的是 ![]() 和
和 ![]() 之间的斜率。因此,函数真实的导数和式 (3.4) 中计算得到的导数的值在严格意义上并不一致。
之间的斜率。因此,函数真实的导数和式 (3.4) 中计算得到的导数的值在严格意义上并不一致。
舍入误差:因省略小数的精细部分的数值(比如,小数点后第 8 位以后的数值)而造成最终的计算结果上的误差。比如,在 Python 中,舍入误差可如下表示。
>>> import numpy as np
>>> np.float32(1e-50)
0.0
如上所示,如果用 float32 类型(32位的浮点数)来表示 le-50,就会变成 0.0,无法正确表示出![]() 来。也就是说,使用过小的值会造成计算机出现计算上的问题。
来。也就是说,使用过小的值会造成计算机出现计算上的问题。
(3)数值微分(数值梯度)
关于式 (3.4) 中函数的导数公式,做如下两点改进:
a、将微小值 ![]() 改为
改为 ![]() ,使用
,使用 ![]() 就可以得到正确的结果;
就可以得到正确的结果;
b、将计算函数 ![]() 在
在 ![]() 和
和 ![]() 之间的差分改为计算函数
之间的差分改为计算函数 ![]() 在
在 ![]() 和
和 ![]() 之间的差分。
之间的差分。
中心差分:以 ![]() 为中心计算它左右两边的差分的计算方法称为中心差分(而
为中心计算它左右两边的差分的计算方法称为中心差分(而 ![]() 和
和 ![]() 之间的差分称为前向差分)。
之间的差分称为前向差分)。
>>> def numerical_diff(f, x):
...     h = 1e-4    # 0.0001
...     return (f(x+h) - f(x-h)) / (2*h)
(4)数值微分(numerical differentiation)与解析性(analytic)
数值微分(numerical differentiation):利用微小的差分求导数的过程,称为数值微分(numerical differentiation)。
解析性(analytic):基于数学式的推导求导数的过程,用 “解析性”(analytic)一词,称为 “解析性求解” 或者 “解析性求导”。
比如,![]() 的导数,可以通过
的导数,可以通过 ![]() 解析性地求解出来。因此,当
解析性地求解出来。因此,当 ![]() 时,
时,![]() 的导数为 4。
的导数为 4。
注:解析性求导得到的导数是不含误差的 “真的导数”。
3.2 数值微分的例子
(1)使用上述的数值微分对简单函数进行求导。函数如下式所示(2次函数)。
![]()
(2)用 Python 实现式 (3.5),如下所示。
def quadratic_function(x):
    """
    函数
    :param x:
    :return:
    """
    return 0.01 * x ** 2 + 0.1 * x
(3)计算函数在 x=5 和 x = 10 处的导数
"""
数值微分
"""
import numpy as np
from matplotlib import pyplot as plt


def numerical_diff(f, x):
    """
    求导数
    :param f:
    :param x:
    :return:
    """
    h = 1e-4    # 0.0001
    return (f(x+h) - f(x-h)) / (2*h)


def quadratic_function(x):
    """
    函数
    :param x:
    :return:
    """
    return 0.01 * x ** 2 + 0.1 * x


print(numerical_diff(quadratic_function, 5))
print(numerical_diff(quadratic_function, 10))
0.1999999999990898
0.2999999999986347
这里计算的导数是 ![]() 相对于
相对于 ![]() 的变化量,对应函数的斜率。
的变化量,对应函数的斜率。
和上面的结果相比,虽然严格意义上它们并不一致,但误差非常小。实际上,误差小到基本上可以认为它们是相等的。
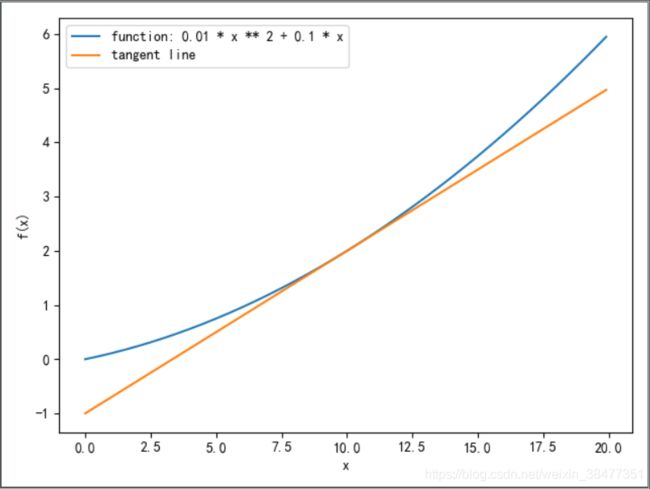
(4)绘制函数和切线图像
"""
数值微分
"""
import numpy as np
from matplotlib import pyplot as plt


def numerical_diff(f, x):
    """
    求导数
    :param f:
    :param x:
    :return:
    """
    h = 1e-4    # 0.0001
    return (f(x+h) - f(x-h)) / (2*h)


def quadratic_function(x):
    """
    函数
    :param x:
    :return:
    """
    return 0.01 * x ** 2 + 0.1 * x


def tangent_line(f, x):
    """
    切线
    :param f: 函数
    :param x: 参数
    :return:
    """
    d = numerical_diff(f, x)
    y = f(x) - d*x
    return lambda t: d*t + y


x = np.arange(0.0, 20.0, 0.1)   # 以0.1为单位,从0到20的数组x
y = quadratic_function(x)
plt.xlabel("x")
plt.ylabel("f(x)")

# tf = tangent_line(quadratic_function, 5)
tf = tangent_line(quadratic_function, 10)
y2 = tf(x)

plt.plot(x, y, label="function: 0.01 * x ** 2 + 0.1 * x")
plt.plot(x, y2, label="tangent line")
plt.legend(loc='best')
plt.show()
图 3-7 x=10 处的切线
3.3 偏导数
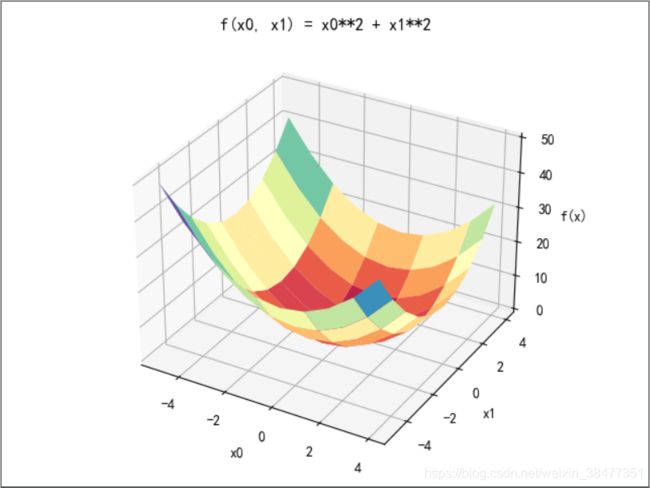
(1)实现函数 ![]()
"""
偏导数
"""
import numpy as np
from matplotlib import pyplot as plt


def numerical_diff(f, x):
    """
    求导数
    :param f:
    :param x:
    :return:
    """
    h = 1e-4    # 0.0001
    return (f(x+h) - f(x-h)) / (2*h)


def quadratic_function(x):
    """
    函数
    :param x:
    :return:
    """
    return x[0]**2 + x[1]**2
    # return np.sum(x**2)


x0, x1 = np.mgrid[-5:5:1, -5:5:1]
y = quadratic_function(np.array([x0, x1]))

# 三维图形
ax = plt.subplot(111, projection="3d")
ax.set_title("f(x0, x1) = x0**2 + x1**2")
ax.plot_surface(x0, x1, y, rstride=2, cstride=1, cmap=plt.cm.Spectral)

# 设置坐标轴标签
ax.set_xlabel("x0")
ax.set_ylabel("x1")
ax.set_zlabel("f(x)")
plt.show()
图 3-8 f(x0, x1)=x0**2 + x1**2 的图像
(2)偏导数
![]()
式 (3.6) 中有两个变量,所以有必要区分对哪个变量求导数,即对 ![]() 和
和 ![]() 两个变量中的哪一个求导。我们把这里讨论的有多个变量的函数的导数称为偏导数。用数学式表示的话,可以写成
两个变量中的哪一个求导。我们把这里讨论的有多个变量的函数的导数称为偏导数。用数学式表示的话,可以写成 ![]() 、
、![]() 。
。
怎么求偏导数?
答:a、偏导数和单变量的导数一样,都是求某个地方的斜率;
b、偏导数需要将多个变量中的某一个变量定为目标变量,并将其他变量固定为某个值。
问题1:求 ![]() ,
,![]() 时,关于
时,关于 ![]() 的偏导数
的偏导数 ![]() 。
。
解题方案:定义一个固定 ![]() 的函数,然后对只有变量
的函数,然后对只有变量 ![]() 的函数应用求数值微分的函数。
的函数应用求数值微分的函数。
问题2:求 ![]() ,
,![]() 时,关于
时,关于 ![]() 的偏导数
的偏导数 ![]() 。
。
解题方案:定义一个固定 ![]() 的函数,然后对只有变量
的函数,然后对只有变量 ![]() 的函数应用求数值微分的函数。
的函数应用求数值微分的函数。
解析求导:![]()
"""
偏导数
"""
import numpy as np


def numerical_diff(f, x):
    """
    求导数
    :param f:
    :param x:
    :return:
    """
    h = 1e-4    # 0.0001
    return (f(x+h) - f(x-h)) / (2*h)


def function_temp0(x0):
    return x0 * x0 + 4.0 ** 2.0


def function_temp1(x1):
    return 3.0 ** 2.0 + x1 * x1


print(numerical_diff(function_temp0, 3.0))  # 6.00000000000378
print(numerical_diff(function_temp1, 4.0))  # 7.999999999999119
4、梯度
同时计算函数 ![]() 中
中 ![]() 和
和 ![]() 的偏导数。比如,我们来考虑
的偏导数。比如,我们来考虑 ![]() ,
,![]() 时
时 ![]() 的偏导数
的偏导数 ![]() 。
。
像 ![]() 这样的由全部变量的偏导数汇总而成的向量称为梯度(gradient)。
这样的由全部变量的偏导数汇总而成的向量称为梯度(gradient)。
梯度指示的方向:各点处的函数值减小最多的方向。
Python 代码实现函数 ![]() 的梯度:
的梯度:
"""
函数梯度实现
"""
import numpy as np
from matplotlib import pyplot as plt


def numerical_gradient_no_batch(f, x):
    h = 1e-4    # 0.0001
    grad = np.zeros_like(x)     # 生成和x形状相同的全0数组

    for idx in range(x.size):
        tmp_val = x[idx]

        x[idx] = tmp_val + h
        fxh1 = f(x)     # f(x+h)的计算

        x[idx] = tmp_val - h
        fxh2 = f(x)     # f(x-h) 的计算

        grad[idx] = (fxh1 - fxh2) / (2*h)
        x[idx] = tmp_val    # 还原值

    return grad


def numerical_gradient(f, X):
    if X.ndim == 1:
        return numerical_gradient_no_batch(f, X)
    else:
        grad = np.zeros_like(X)     # 生成和x形状相同的全0数组

        for idx, x in enumerate(X):
            grad[idx] = numerical_gradient_no_batch(f, x)

        return grad


def function(x):
    if x.ndim == 1:
        return np.sum(x**2)
    else:
        return np.sum(x**2, axis=1)


if __name__ == '__main__':
    print(numerical_gradient(function, np.array([3.0, 4.0])))   # [6. 8.]
    print(numerical_gradient(function, np.array([0.0, 2.0])))   # [0. 4.]
    print(numerical_gradient(function, np.array([3.0, 0.0])))   # [6. 0.]
    x0 = np.arange(-2, 2.5, 0.25)
    x1 = np.arange(-2, 2.5, 0.25)
    X, Y = np.meshgrid(x0, x1)  # 生成网格坐标矩阵

    X = X.flatten()
    Y = Y.flatten()

    grad = numerical_gradient(function, np.array([X, Y]))

    plt.figure()
    plt.quiver(X, Y, -grad[0], -grad[1], angles="xy", color="#666666")
    plt.xlim([-2, 2])
    plt.ylim([-2, 2])
    plt.xlabel('x0')
    plt.ylabel('x1')
    plt.grid()
    plt.legend()
    plt.draw()
plt.show()4.1 梯度法
(1)相关定义
梯度:梯度表示的是各点处的函数值减小最多的方向。
梯度法(gradient method):通过不断地沿梯度方向前进,逐渐减小函数值的过程就是梯度法(gradient method)。在梯度法中,函数的取值从当前位置沿着梯度方向前进一定距离,然后在新的地方重新求梯度,再沿着新梯度方向前进,如此反复,不断地沿梯度方向前进。
极小值:局部极小值,也就是限定在某个范围内的最小值。
鞍点(saddle point):从某个方向上看是极大值,从另一个方向上看则是极小值的点。
梯度下降法:寻找最小值的梯度法称为梯度下降法(gradient descent method)。
梯度上升法:寻找最大值的梯度法称为梯度上升法(gradient ascent method)。
超参数:像学习率这样的参数称为超参数。(神经网络的权重参数是通过训练数据和学习算法自动获得的,学习率这样的超参数则是人工设定的。一般来说,超参数需要尝试多个值,以便找到一种可以使学习顺利进行的设定)
注意:
a、函数的极小值、最小值、鞍点(saddle point)的地方,梯度为 0;
b、虽然梯度是要寻找梯度为 0 的地方,但是那个地方不一定就是最小值(也有可能是极小时或者鞍点);
c、当函数很复杂且呈扁平状时,学习可能会进入一个(几乎)平坦的地区,陷入被称为 “学习高原” 的无法前进的停滞期;
d、通过反转损失函数的符号,求最小值的问题和求最大值的问题会变成相同的问题,因此 “下降” 还是 “上升” 的差异本质上并不重要。
(2)用数学公式表示梯度法,如式 (3.7) 所示
![]() :更新量,在神经网络的学习中,称为学习率(learning rate)。学习率决定在一次学习中,应该学习多少,以及在多大程度上更新参数。
:更新量,在神经网络的学习中,称为学习率(learning rate)。学习率决定在一次学习中,应该学习多少,以及在多大程度上更新参数。
注意:学习率需要事先确定为某个值,比如 0.01 或 0.001。一般而言,这个值过大或过小,都无法抵达一个 “好的位置”。在神经网络的学习中,一般会一遍改变学习率的值,一边确认学习是否正确进行了。
(3)用 Python 实现梯度下降法
问题:请用梯度法求 ![]() 的最小值。
的最小值。
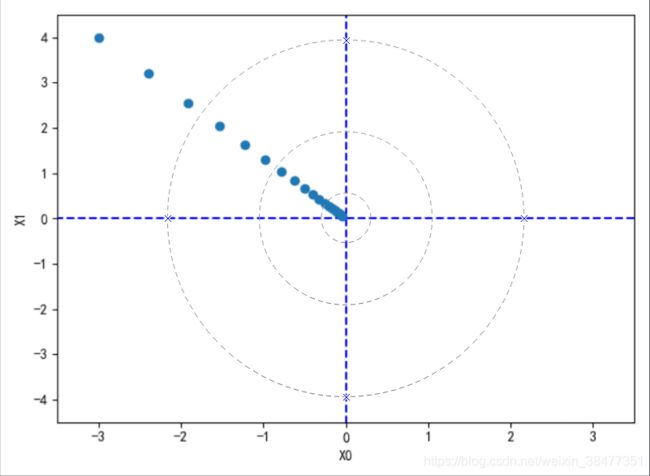
最终的结果是 [-0.03458765 0.04611686],非常接近于 [0, 0]。实际上,真的最小值就是 [0, 0],所以说通过梯度法我们基本得到了正确结果。
如图 3-10 所示,可以发现原点处是最低的地方,函数的取值一点点在向其靠近。
"""
梯度法
"""
import numpy as np
from matplotlib import pyplot as plt


def numerical_gradient_no_batch(f, x):
    h = 1e-4    # 0.0001
    grad = np.zeros_like(x)     # 生成和x形状相同的全0数组

    for idx in range(x.size):
        tmp_val = x[idx]

        x[idx] = tmp_val + h
        fxh1 = f(x)     # f(x+h)的计算

        x[idx] = tmp_val - h
        fxh2 = f(x)     # f(x-h) 的计算

        grad[idx] = (fxh1 - fxh2) / (2*h)
        x[idx] = tmp_val    # 还原值

    return grad


def numerical_gradient(f, X):
    if X.ndim == 1:
        return numerical_gradient_no_batch(f, X)
    else:
        grad = np.zeros_like(X)     # 生成和x形状相同的全0数组

        for idx, x in enumerate(X):
            grad[idx] = numerical_gradient_no_batch(f, x)

        return grad


def function(x):
    if x.ndim == 1:
        return np.sum(x**2)
    else:
        return np.sum(x**2, axis=1)


def gradient_descent(f, init_x, lr=0.01, step_num=1000):
    """
    梯度下降法
    :param f: 要进行最优化的函数
    :param init_x: 初始值
    :param lr: 学习率(learning rate)
    :param step_num: 重复次数
    :return:
    """
    x = init_x
    x_history = []

    # 重复step_num次
    for i in range(step_num):
        x_history.append(x.copy())
        # 求函数的梯度
        grad = numerical_gradient(f, x)
        # 更新参数值
        x -= lr * grad

    return x, np.array(x_history)


init_x = np.array([-3.0, 4.0])
lr = 0.1
step_num = 20
print(f"init_x: {init_x}")  # init_x: [-3.  4.]
x, x_history = gradient_descent(function, init_x, lr=lr, step_num=step_num)
print(f"x: {x}")    # x: [-0.03458765  0.04611686]

# 画图
plt.plot([-5, 5], [0, 0], "--b")
plt.plot([0, 0], [-5, 5], "--b")
plt.plot(x_history[:, 0], x_history[:, 1], "o")

plt.xlim(-3.5, 3.5)
plt.ylim(-4.5, 4.5)
plt.xlabel("X0")
plt.ylabel("X1")
plt.show()
图 3-10 f(x0, x1)=x0**2 + x1**2 的梯度法的更新过程:虚线是函数的等高线
(4)学习率过大或者过小都无法得到好的结果,实验验证
学习率过大, 会发散成一个很大的值;学习率过小,基本上没怎么更新就结束了。
"""
梯度法中学习率过大/过小实验验证
"""
import numpy as np
from matplotlib import pyplot as plt


def numerical_gradient_no_batch(f, x):
    h = 1e-4    # 0.0001
    grad = np.zeros_like(x)     # 生成和x形状相同的全0数组

    for idx in range(x.size):
        tmp_val = x[idx]

        x[idx] = tmp_val + h
        fxh1 = f(x)     # f(x+h)的计算

        x[idx] = tmp_val - h
        fxh2 = f(x)     # f(x-h) 的计算

        grad[idx] = (fxh1 - fxh2) / (2*h)
        x[idx] = tmp_val    # 还原值

    return grad


def numerical_gradient(f, X):
    if X.ndim == 1:
        return numerical_gradient_no_batch(f, X)
    else:
        grad = np.zeros_like(X)     # 生成和x形状相同的全0数组

        for idx, x in enumerate(X):
            grad[idx] = numerical_gradient_no_batch(f, x)

        return grad


def function(x):
    if x.ndim == 1:
        return np.sum(x**2)
    else:
        return np.sum(x**2, axis=1)


def gradient_descent(f, init_x, lr=0.01, step_num=1000):
    """
    梯度下降法
    :param f: 要进行最优化的函数
    :param init_x: 初始值
    :param lr: 学习率(learning rate)
    :param step_num: 重复次数
    :return:
    """
    x = init_x

    # 重复step_num次
    for i in range(step_num):
        # 求函数的梯度
        grad = numerical_gradient(f, x)
        # 更新参数值
        x -= lr * grad

    return x


# 学习率过大的例子:lr=10.0
init_x = np.array([-3.0, 4.0])  # [-3, 4]
lr = 10.0
step_num = 20
x1 = gradient_descent(function, init_x, lr=lr, step_num=step_num)
print(f"x: {x1}")    # x: [-2.58983747e+13 -1.29524862e+12]

# 学习率过小的例子:lr=le-10
init_x = np.array([-3.0, 4.0])  # [-3, 4]
lr = 1e-10
step_num = 20
x2 = gradient_descent(function, init_x, lr=lr, step_num=step_num)
print(f"x: {x2}")    # [-2.99999999  3.99999998]
4.2 神经网络的梯度
这里所说的梯度是指:损失函数关于权重参数的梯度。
![]()
![]() :形状为 2 x 3 的权重参数。
:形状为 2 x 3 的权重参数。
![]() :损失函数。
:损失函数。
![]() :形状为 2 x 3 的损失函数的梯度。
:形状为 2 x 3 的损失函数的梯度。
"""
神经网络的梯度
"""

import numpy as np


def numerical_gradient(f, x):
    """
    求梯度
    :param f: 函数
    :param x: 传给函数f的参数
    :return:
    """
    h = 1e-4  # 0.0001
    grad = np.zeros_like(x)

    it = np.nditer(x, flags=['multi_index'], op_flags=['readwrite'])
    while not it.finished:
        idx = it.multi_index
        tmp_val = x[idx]
        x[idx] = float(tmp_val) + h
        fxh1 = f(x)  # f(x+h)

        x[idx] = tmp_val - h
        fxh2 = f(x)  # f(x-h)
        grad[idx] = (fxh1 - fxh2) / (2 * h)

        x[idx] = tmp_val  # 还原值
        it.iternext()

    return grad


def softmax(x):
    """
    softmax 激活函数
    :param x:
    :return:
    """
    if x.ndim == 2:
        x = x.T
        x = x - np.max(x, axis=0)
        y = np.exp(x) / np.sum(np.exp(x), axis=0)
        return y.T

    x = x - np.max(x)   # 溢出对策
    return np.exp(x) / np.sum(np.exp(x))


def cross_entropy_error(y, t):
    """
    交叉熵误差
    :param y: 神经网络输出
    :param t: 训练数据标签值(one-hot形式)
    :return: 交叉熵误差
    """
    # y的维度为1维时,即求单个数据的交叉熵误差时,需要改变数据的形状
    if y.ndim == 1:
        t = t.reshape(1, t.size)
        y = y.reshape(1, y.size)

    # 监督数据是one-hot-vector的情况下,转换为正确解标签的索引
    if t.size == y.size:
        t = t.argmax(axis=1)

    batch_size = y.shape[0]
    return -np.sum(np.log(y[np.arange(batch_size), t] + 1e-7)) / batch_size


class simpleNet(object):
    def __init__(self):
        # 用高斯分布进行初始化(形状为2x3的权重参数)
        self.w = np.random.randn(2, 3)

    def predict(self, x):
        """
        预测
        :param x:
        :return:
        """
        return np.dot(x, self.w)

    def loss(self, x, t):
        """
        求损失函数的值
        :param x: 输入数据
        :param t: 正确解标签
        :return:
        """
        # 预测
        z = self.predict(x)
        # softmax激活函数
        y = softmax(z)
        # 求交叉熵误差损失函数
        loss = cross_entropy_error(y, t)
        return loss


x = np.array([0.6, 0.9])
net = simpleNet()
# 正确解标签
t = np.array([0, 0, 1])
# 求损失函数的值
loss = net.loss(x, t)

# loss损失函数
f = lambda w: net.loss(x, t)
# 求损失函数的梯度
dw = numerical_gradient(f, net.w)
print(dw)
[[ 0.02542538 0.28858445 -0.31400983]
[ 0.03813807 0.43287668 -0.47101475]] 结果发现,![]() 中:
中:![]() 应向正方向更新;
应向正方向更新;![]() 应向负方向更新。
应向负方向更新。![]() 更新的程度比
更新的程度比 ![]() 的大。
的大。
(1)![]() 的值大约是 0.2,这表示如果将
的值大约是 0.2,这表示如果将 ![]() 增加
增加 ![]() ,那么损失函数的值将增加 0.2h。
,那么损失函数的值将增加 0.2h。
(2)![]() 的值大约是 -0.5,这表示如果将
的值大约是 -0.5,这表示如果将 ![]() 增加
增加 ![]() ,那么损失函数的值将减小 0.5h。
,那么损失函数的值将减小 0.5h。
5、学习算法的实现
神经网络的学习步如下所示。
前提
神经网络存在合适的权重和偏置,调整权重和偏置以便拟合训练数据的过程称为 “学习”。神经网络的学习分成下面 4 个步骤。
步骤 1 (mini-batch)
从训练数据中随机选出一部分数据,这部分数据称为 mini-batch。我们的目标是减小 mini-batch 的损失函数的值。
步骤 2 (计算梯度)
为了减小 mini-batch 的损失函数的值,需要求出各个权重参数的梯度。梯度表示损失函数的值减小最多的方向。
步骤 3 (更新参数)
将权重参数沿梯度方向进行微小更新。
步骤 4 (重复)
重复步骤 1、步骤 2、步骤 3。
神经网络的学习按照上面 4 个步骤进行。这个方法通过梯度下降法更新参数,不过因为这里使用的数据是随机选择的 mini-batch 数据,所以又称为随机梯度下降法(stochastic gradient descent)。“随机” 指的是 “随机选择的” 的意思,因此,随机梯度下降法是 “对随机选择的数据进行的梯度下降法”。
5.1 实现手写数字识别的神经网络
"""
手写数字识别神经网络
"""

import os
import sys
import numpy as np
from matplotlib import pyplot as plt

sys.path.append(os.pardir)
from dataset.mnist import load_mnist


class Function(object):
    def sigmoid(self, x):
        """sigmoid"""
        return 1 / (1 + np.exp(-x))

    def sigmoid_grad(self, x):
        return (1.0 - self.sigmoid(x)) * self.sigmoid(x)

    def softmax(self, x):
        """softmax"""
        if x.ndim == 2:
            x = x.T
            x = x - np.max(x, axis=0)
            y = np.exp(x) / np.sum(np.exp(x), axis=0)
            return y.T

        x = x - np.max(x)   # 溢出对策
        return np.exp(x) / np.sum(np.exp(x))

    def cross_entropy_error(self, y, t):
        """交叉熵误差"""
        if y.ndim == 1:
            t = t.reshape(1, t.size)
            y = y.reshape(1, y.size)

        # 监督数据是one-hot-vector的情况下,转换为正确解标签的索引
        if t.size == y.size:
            t = t.argmax(axis=1)

        batch_size = y.shape[0]
        return -np.sum(np.log(y[np.arange(batch_size), t] + 1e-7)) / batch_size

    def numerical_gradient(self, f, x):
        """
        计算梯度
        :param f: 函数
        :param x: 传给函数f的参数
        :return:
        """
        h = 1e-4  # 0.0001
        grad = np.zeros_like(x)

        it = np.nditer(x, flags=['multi_index'], op_flags=['readwrite'])
        while not it.finished:
            idx = it.multi_index
            tmp_val = x[idx]
            x[idx] = float(tmp_val) + h
            fxh1 = f(x)  # f(x+h)

            x[idx] = tmp_val - h
            fxh2 = f(x)  # f(x-h)
            grad[idx] = (fxh1 - fxh2) / (2 * h)

            x[idx] = tmp_val  # 还原值
            it.iternext()

        return grad


class TwoLayerNet(object):
    """2层神经网络(隐藏层为1层)"""
    def __init__(self, input_size, hidden_size, output_size, weight_init_std=0.01):
        """
        初始化
        :param input_size: 输入层的神经元数
        :param hidden_size: 隐藏层的神经元数
        :param output_size: 输出层的神经元数
        """
        # 初始化权重(权重使用符合高斯分布的随机数进行初始化,偏置使用0进行初始化)
        # 保存神经网络的参数的字典变量(实例变量)
        self.params = {}
        # 第1层的权重
        self.params["w1"] = weight_init_std * np.random.randn(input_size, hidden_size)
        # 第1层的偏置
        self.params["b1"] = np.zeros(hidden_size)
        # 第2层的权重
        self.params["w2"] = weight_init_std * np.random.randn(hidden_size, output_size)
        # 第2层的偏置
        self.params["b2"] = np.zeros(output_size)
        # 函数类
        self.f = Function()

    def predict(self, x):
        """
        进行识别(推理)
        :param x: 图像数据
        :return:
        """
        w1, w2 = self.params["w1"], self.params["w2"]
        b1, b2 = self.params["b1"], self.params["b2"]

        a1 = np.dot(x, w1) + b1
        z1 = self.f.sigmoid(a1)
        a2 = np.dot(z1, w2) + b2
        y = self.f.softmax(a2)

        return y

    def loss(self, x, t):
        """
        计算损失函数的值
        :param x: 图像数据
        :param t: 正确解标签
        :return:
        """
        y = self.predict(x)
        return self.f.cross_entropy_error(y, t)

    def accuracy(self, x, t):
        """
        计算识别精度
        :param x: 图像数据
        :param t: 正确解标签
        :return:
        """
        y = self.predict(x)
        y = np.argmax(y, axis=1)
        t = np.argmax(t, axis=1)

        accuracy = np.sum(y == t) / float(x.shape[0])
        return accuracy

    def gradient(self, x, t):
        w1, w2 = self.params["w1"], self.params["w2"]
        b1, b2 = self.params["b1"], self.params["b2"]
        grads = {}

        batch_num = x.shape[0]

        # forward
        a1 = np.dot(x, w1) + b1
        z1 = self.f.sigmoid(a1)
        a2 = np.dot(z1, w2) + b2
        y = self.f.softmax(a2)

        # backward
        dy = (y - t) / batch_num
        grads["w2"] = np.dot(z1.T, dy)
        grads["b2"] = np.sum(dy, axis=0)

        da1 = np.dot(dy, w2.T)
        dz1 = self.f.sigmoid_grad(a1) * da1
        grads["w1"] = np.dot(x.T, dz1)
        grads["b1"] = np.sum(dz1, axis=0)

        return grads

    def numerical_gradient(self, x, t):
        """
        计算权重参数的梯度
        :param x: 图像数据
        :param t: 正确解标签
        :return:
        """
        loss_w = lambda w: self.loss(x, t)

        # 保存梯度的字典变量
        grads = {}
        # 第1层权重的梯度
        grads["w1"] = self.f.numerical_gradient(loss_w, self.params["w1"])
        # 第1层偏置的梯度
        grads["b1"] = self.f.numerical_gradient(loss_w, self.params["b1"])
        # 第2层权重的梯度
        grads["w2"] = self.f.numerical_gradient(loss_w, self.params["w2"])
        # 第2层偏置的梯度
        grads["b2"] = self.f.numerical_gradient(loss_w, self.params["b2"])

        return grads


class MiniBatch(object):
    """mini-batch学习"""
    def run(self):
        (x_train, y_train), (x_test, y_test) = load_mnist(normalize=True, one_hot_label=True)

        train_loss_list = []
        train_acc_list = []
        test_acc_list = []

        # 超参数
        iters_num = 10000
        train_size = x_train.shape[0]
        batch_size = 100
        learning_rate = 0.1
        # 平均每个epoch的重复次数
        iter_per_epoch = max(train_size / batch_size, 1)
        network = TwoLayerNet(input_size=784, hidden_size=50, output_size=10)

        for i in range(iters_num):
            # 获取mini-batch,每次从60000个训练数据中随机取出100个数据
            batch_mask = np.random.choice(train_size, batch_size)
            x_batch = x_train[batch_mask]
            y_batch = y_train[batch_mask]

            # 计算梯度
            # grad = network.numerical_gradient(x_batch, y_batch)
            grad = network.gradient(x_batch, y_batch)

            # 更新参数
            for key in ("w1", "b1", "w2", "b2"):
                network.params[key] -= learning_rate * grad[key]

            # 记录学习过程
            loss = network.loss(x_batch, y_batch)
            train_loss_list.append(loss)

            # 计算每个epoch的识别精度
            if i % iter_per_epoch == 0:
                train_acc = network.accuracy(x_train, y_train)
                test_acc = network.accuracy(x_test, y_test)
                train_acc_list.append(train_acc)
                test_acc_list.append(test_acc)
                print("train acc, test acc | " + str(train_acc) + ", " + str(test_acc))

        # 绘制loss图形
        x = np.arange(len(train_loss_list))
        plt.plot(x, train_loss_list, label="loss")
        plt.xlabel("iteration")
        plt.ylabel("loss")
        plt.ylim(0, 1.0)
        plt.legend(loc="lower right")
        plt.show()

        # 绘制acc图形
        x = np.arange(len(train_acc_list))
        plt.plot(x, train_acc_list, label="train acc")
        plt.plot(x, test_acc_list, label="test acc", linestyle="--")
        plt.xlabel("epochs")
        plt.ylabel("accuracy")
        plt.ylim(0, 1.0)
        plt.legend(loc="lower right")
        plt.show()


if __name__ == "__main__":
    mini_batch = MiniBatch()
    mini_batch.run()