Hadoop离线 day20 数据仓库设计、ETL和统计分析
数据仓库设计、ETL和统计分析
- 二、 模块开发----数据仓库设计
- 1. 维度建模基本概念
- 2. 维度建模三种模式
-
- 2.1. 星型模式
- 2.2. 雪花模式
- 2.3. 星座模式
- 3.2. 维度表设计
- 三、 模块开发----ETL
- 1. 创建ODS层数据表
-
- 1.1. 原始日志数据表
- 3. 生成ODS层明细宽表
-
- 3.1. 需求实现
- 3.2. ETL实现
- 四、 模块开发----统计分析
- 1. 流量分析
-
- 1.1. 多维度统计PV总量
- 1.2. 人均浏览量
- 1.3. 统计pv总量最大的来源TOPN (分组TOP)
- 2. 受访分析(从页面的角度分析)
-
- 2.1. 各页面访问统计
- 2.2. 热门页面统计
- 3. 访客分析
-
- 3.1. 独立访客
- 3.2. 每日新访客
- 4. 访客Visit分析(点击流模型)
-
- 4.1. 回头/单次访客统计
二、 模块开发----数据仓库设计
1. 维度建模基本概念
维度建模(dimensional modeling)是专门用于分析型数据库、数据仓库、数据集市建模的方法。数据集市可以理解为是一种"小型数据仓库"。
- 维度表(dimension)
维度表示你要对数据进行分析时所用的一个量,比如你要分析产品销售情况, 你可以选择按类别来进行分析,或按区域来分析。这样的按…分析就构成一个维度。再比如"昨天下午我在星巴克花费200元喝了一杯卡布奇诺"。那么以消费为主题进行分析,可从这段信息中提取三个维度:时间维度(昨天下午),地点维度(星巴克), 商品维度(卡布奇诺)。通常来说维度表信息比较固定,且数据量小。
- 事实表(fact table)
表示对分析主题的度量。事实表包含了与各维度表相关联的外键,并通过JOIN方式与维度表关联。事实表的度量通常是数值类型,且记录数会不断增加,表规模迅速增长。比如上面的消费例子,它的消费事实表结构示例如下:
消费事实表:Prod_id(引用商品维度表), TimeKey(引用时间维度表), Place_id(引用地点维度表), Unit(销售量)。
总的说来,在数据仓库中不需要严格遵守规范化设计原则。因为数据仓库的主导功能就是面向分析,以查询为主,不涉及数据更新操作。事实表的设计是以能够正确记录历史信息为准则,维度表的设计是以能够以合适的角度来聚合主题内容为准则。
2. 维度建模三种模式
2.1. 星型模式
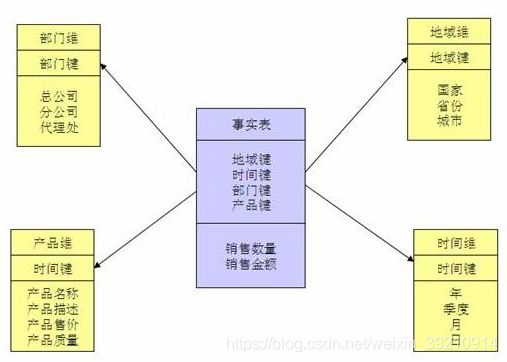
星形模式(Star Schema)是最常用的维度建模方式。星型模式是以事实表为中心,所有的维度表直接连接在事实表上,像星星一样。
星形模式的维度建模由一个事实表和一组维表成,且具有以下特点:
a. 维表只和事实表关联,维表之间没有关联;
b. 每个维表主键为单列,且该主键放置在事实表中,作为两边连接的外键;
c. 以事实表为核心,维表围绕核心呈星形分布;
2.2. 雪花模式
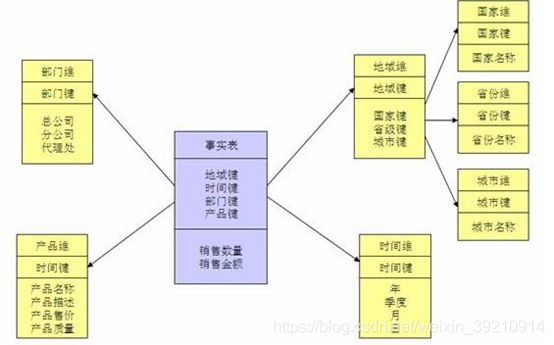
雪花模式(Snowflake Schema)是对星形模式的扩展。雪花模式的维度表可以拥有其他维度表的,虽然这种模型相比星型更规范一些,但是由于这种模型不太容易理解,维护成本比较高,而且性能方面需要关联多层维表,性能也比星型模型要低。所以一般不是很常用。
2.3. 星座模式
星座模式是星型模式延伸而来,星型模式是基于一张事实表的,而星座模式是基于多张事实表的,而且共享维度信息。
前面介绍的两种维度建模方法都是多维表对应单事实表,但在很多时候维度空间内的事实表不止一个,而一个维表也可能被多个事实表用到。在业务发展后期,绝大部分维度建模都采用的是星座模式。

3. 本项目中数据仓库的设计
注:采用星型模型
3.1. 事实表设计
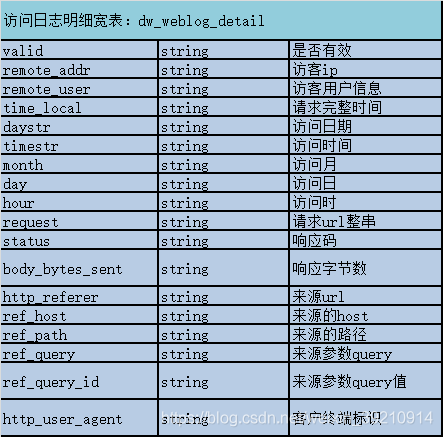
3.2. 维度表设计

注意:
维度表的数据一般要结合业务情况自己写脚本按照规则生成,也可以使用工具生成,方便后续的关联分析。
比如一般会事前生成时间维度表中的数据,跨度从业务需要的日期到当前日期即可.具体根据你的分析粒度,可以生成年,季,月,周,天,时等相关信息,用于分析。
三、 模块开发----ETL
ETL工作的实质就是从各个数据源提取数据,对数据进行转换,并最终加载填充数据到数据仓库维度建模后的表中。只有当这些维度/事实表被填充好,ETL工作才算完成。
本项目的数据分析过程在hadoop集群上实现,主要应用hive数据仓库工具,因此,采集并经过预处理后的数据,需要加载到hive数据仓库中,以进行后续的分析过程。
1. 创建ODS层数据表
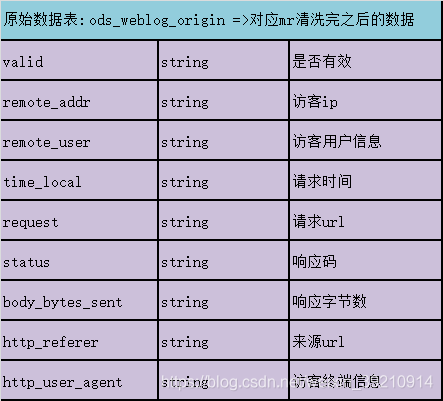
1.1. 原始日志数据表
drop table if exists ods_weblog_origin;
create table ods_weblog_origin(
valid string,
remote_addr string,
remote_user string,
time_local string,
request string,
status string,
body_bytes_sent string,
http_referer string,
http_user_agent string)
partitioned by (datestr string)
row format delimited
fields terminated by '\001';
1.2. 点击流模型pageviews表
drop table if exists ods_click_pageviews;
create table ods_click_pageviews(
session string,
remote_addr string,
remote_user string,
time_local string,
request string,
visit_step string,
page_staylong string,
http_referer string,
http_user_agent string,
body_bytes_sent string,
status string)
partitioned by (datestr string)
row format delimited
fields terminated by '\001';
1.3. 点击流visit模型表
drop table if exist ods_click_stream_visit;
create table ods_click_stream_visit(
session     string,
remote_addr string,
inTime      string,
outTime     string,
inPage      string,
outPage     string,
referal     string,
pageVisits  int)
partitioned by (datestr string)
row format delimited
fields terminated by '\001';
2. 导入ODS层数据
load data inpath '/weblog/preprocessed/' overwrite into table
ods_weblog_origin partition(datestr='20130918');--数据导入
show partitions ods_weblog_origin;---查看分区
select count(*) from ods_weblog_origin; --统计导入的数据总数
点击流模型的两张表数据导入操作同上。
注:生产环境中应该将数据load命令,写在脚本中,然后配置在azkaban中定时运行,注意运行的时间点,应该在预处理数据完成之后。
3. 生成ODS层明细宽表
3.1. 需求实现
整个数据分析的过程是按照数据仓库的层次分层进行的,总体来说,是从ODS原始数据中整理出一些中间表(比如,为后续分析方便,将原始数据中的时间、url等非结构化数据作结构化抽取,将各种字段信息进行细化,形成明细表),然后再在中间表的基础之上统计出各种指标数据。
3.2. ETL实现
建明细表ods_weblog_detail:
drop table ods_weblog_detail;
create table ods_weblog_detail(
valid           string, --有效标识
remote_addr     string, --来源IP
remote_user     string, --用户标识
time_local      string, --访问完整时间
daystr          string, --访问日期
timestr         string, --访问时间
month           string, --访问月
day             string, --访问日
hour            string, --访问时
request         string, --请求的url
status          string, --响应码
body_bytes_sent string, --传输字节数
http_referer    string, --来源url
ref_host        string, --来源的host
ref_path        string, --来源的路径
ref_query       string, --来源参数query
ref_query_id    string, --来源参数query的值
http_user_agent string --客户终端标识
)
partitioned by(datestr string);
通过查询插入数据到明细宽表 ods_weblog_detail中
1、 抽取refer_url到中间表 t_ods_tmp_referurl
也就是将来访url分离出host path query query id
drop table if exists t_ods_tmp_referurl;
create table t_ods_tmp_referurl as
SELECT a.*,b.*
FROM ods_weblog_origin a
LATERAL VIEW parse_url_tuple(regexp_replace(http_referer, "\"", ""), 'HOST', 'PATH','QUERY', 'QUERY:id') b as host, path, query, query_id;
注:lateral view用于和split, explode等UDTF一起使用,它能够将一列数据拆成多行数据。
UDTF(User-Defined Table-Generating Functions) 用来解决输入一行输出多行(On-to-many maping) 的需求。Explode也是拆列函数,比如Explode (ARRAY) ,array中的每个元素生成一行。
2、抽取转换time_local字段到中间表明细表 t_ods_tmp_detail
drop table if exists t_ods_tmp_detail;
create table t_ods_tmp_detail as
select b.*,substring(time_local,0,10) as daystr,
substring(time_local,12) as tmstr,
substring(time_local,6,2) as month,
substring(time_local,9,2) as day,
substring(time_local,11,3) as hour
from t_ods_tmp_referurl b;
3、以上语句可以合成一个总的语句
insert into table shizhan.ods_weblog_detail partition(datestr='2013-09-18')
select c.valid,c.remote_addr,c.remote_user,c.time_local,
substring(c.time_local,0,10) as daystr,
substring(c.time_local,12) as tmstr,
substring(c.time_local,6,2) as month,
substring(c.time_local,9,2) as day,
substring(c.time_local,11,3) as hour,
c.request,c.status,c.body_bytes_sent,c.http_referer,c.ref_host,c.ref_path,c.ref_query,c.ref_query_id,c.http_user_agent
from
(SELECT
a.valid,a.remote_addr,a.remote_user,a.time_local,
a.request,a.status,a.body_bytes_sent,a.http_referer,a.http_user_agent,b.ref_host,b.ref_path,b.ref_query,b.ref_query_id
FROM shizhan.ods_weblog_origin a LATERAL VIEW
parse_url_tuple(regexp_replace(http_referer, "\"", ""), 'HOST', 'PATH','QUERY', 'QUERY:id') b as ref_host, ref_path, ref_query,
 ref_query_id) c;
四、 模块开发----统计分析
数据仓库建设好以后,用户就可以编写Hive SQL语句对其进行访问并对其中数据进行分析。
在实际生产中,究竟需要哪些统计指标通常由数据需求相关部门人员提出,而且会不断有新的统计需求产生,以下为网站流量分析中的一些典型指标示例。
注:每一种统计指标都可以跟各维度表进行钻取。
1. 流量分析
1.1. 多维度统计PV总量
- 按时间维度
–计算每小时pvs,注意gruop by语法
select count(*) as pvs,month,day,hour from ods_weblog_detail group by month,day,hour;
- 方式一:直接在ods_weblog_detail单表上进行查询
--计算该处理批次(一天)中的各小时pvs
drop table dw_pvs_everyhour_oneday;
create table dw_pvs_everyhour_oneday(month string,day string,hour string,pvs bigint) partitioned by(datestr string);

insert into table dw_pvs_everyhour_oneday partition(datestr='20130918')
select a.month as month,a.day as day,a.hour as hour,count(*) as pvs from ods_weblog_detail a
where  a.datestr='20130918' group by a.month,a.day,a.hour;

--计算每天的pvs
drop table dw_pvs_everyday;
create table dw_pvs_everyday(pvs bigint,month string,day string);

insert into table dw_pvs_everyday
select count(*) as pvs,a.month as month,a.day as day from ods_weblog_detail a
group by a.month,a.day;
- 方式二:与时间维表关联查询
--维度:日
drop table dw_pvs_everyday;
create table dw_pvs_everyday(pvs bigint,month string,day string);

insert into table dw_pvs_everyday
select count(*) as pvs,a.month as month,a.day as day from (select distinct month, day from t_dim_time) a
join ods_weblog_detail b
on a.month=b.month and a.day=b.day
group by a.month,a.day;

--维度:月
drop table dw_pvs_everymonth;
create table dw_pvs_everymonth (pvs bigint,month string);

insert into table dw_pvs_everymonth
select count(*) as pvs,a.month from (select distinct month from t_dim_time)  a
join ods_weblog_detail b on a.month=b.month group by a.month;

--另外,也可以直接利用之前的计算结果。比如从之前算好的小时结果中统计每一天的
Insert into table dw_pvs_everyday
Select sum(pvs) as pvs,month,day from dw_pvs_everyhour_oneday group by month,day having day='18';
-
按终端维度
数据中能够反映出用户终端信息的字段是http_user_agent。
User Agent也简称UA。它是一个特殊字符串头,是一种向访问网站提供所使用的浏览器类型及版本、操作系统及版本、浏览器内核、等信息的标识。例如:
User-Agent,Mozilla/5.0 (Windows NT 6.3; WOW64) AppleWebKit/537.36 (KHTML, like Gecko) Chrome/58.0.3029.276 Safari/537.36 -
按栏目维度
网站栏目可以理解为网站中内容相关的主题集中。体现在域名上来看就是不同的栏目会有不同的二级目录。比如某网站网址为www.xxxx.cn,旗下栏目可以通过如下方式访问:
栏目维度:…/job
栏目维度:…/news
栏目维度:…/sports
栏目维度:…/technology
那么根据用户请求url就可以解析出访问栏目,然后按照栏目进行统计分析。 -
按referer维度
--统计每小时各来访url产生的pv量
drop table dw_pvs_referer_everyhour;
create table dw_pvs_referer_everyhour(referer_url string,referer_host string,month string,day string,hour string,pv_referer_cnt bigint) partitioned by(datestr string);

insert into table dw_pvs_referer_everyhour partition(datestr='20130918')
select http_referer,ref_host,month,day,hour,count(1) as pv_referer_cnt
from ods_weblog_detail
group by http_referer,ref_host,month,day,hour
having ref_host is not null
order by hour asc,day asc,month asc,pv_referer_cnt desc;

--统计每小时各来访host的产生的pv数并排序
drop table dw_pvs_refererhost_everyhour;
create table dw_pvs_refererhost_everyhour(ref_host string,month string,day string,hour string,ref_host_cnts bigint) partitioned by(datestr string);

insert into table dw_pvs_refererhost_everyhour partition(datestr='20130918')
select ref_host,month,day,hour,count(1) as ref_host_cnts
from ods_weblog_detail
group by ref_host,month,day,hour
having ref_host is not null
order by hour asc,day asc,month asc,ref_host_cnts desc;
1.2. 人均浏览量
需求描述:统计今日所有来访者平均请求的页面数。
人均浏览量也称作人均浏览页数,该指标可以说明网站对用户的粘性。
人均页面浏览量表示用户某一时段平均浏览页面的次数。
计算方式:总页面请求数/去重总人数
remote_addr表示不同的用户。可以先统计出不同remote_addr的pv量,然后累加(sum)所有pv作为总的页面请求数,再count所有remote_addr作为总的去重总人数。
--总页面请求数/去重总人数
drop table dw_avgpv_user_everyday;
create table dw_avgpv_user_everyday(
day string,
avgpv string);

insert into table dw_avgpv_user_everyday
select '20130918',sum(b.pvs)/count(b.remote_addr) from
(select remote_addr,count(1) as pvs from ods_weblog_detail where datestr='20130918' group by remote_addr) b;
1.3. 统计pv总量最大的来源TOPN (分组TOP)
需求描述:统计每小时各来访host的产生的pvs数最多的前N个(topN)。
row_number()函数
- 语法:row_number() over (partition by xxx order by xxx) rank,rank为分组的别名,相当于新增一个字段为rank。
- partition by用于分组,比方说依照sex字段分组
- order by用于分组内排序,比方说依照sex分组,组内按照age排序
- 排好序之后,为每个分组内每一条分组记录从1开始返回一个数字
- 取组内某个数据,可以使用where 表名.rank>x之类的语法去取
以下语句对每个小时内的来访host次数倒序排序标号:
select ref_host,ref_host_cnts,concat(month,day,hour),
row_number() over (partition by concat(month,day,hour) order by ref_host_cnts desc) as od from dw_pvs_refererhost_everyhour;
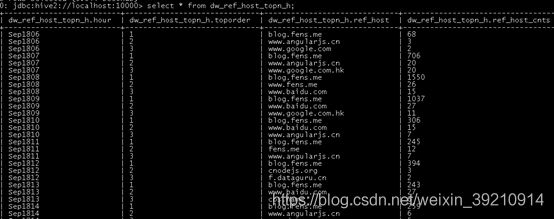
效果如下:

根据上述row_number的功能,可编写hql取各小时的ref_host访问次数topn
drop table dw_pvs_refhost_topn_everyhour;
create table dw_pvs_refhost_topn_everyhour(
hour string,
toporder string,
ref_host string,
ref_host_cnts string
)partitioned by(datestr string);

insert into table dw_pvs_refhost_topn_everyhour partition(datestr='20130918')
select t.hour,t.od,t.ref_host,t.ref_host_cnts from
 (select ref_host,ref_host_cnts,concat(month,day,hour) as hour,
row_number() over (partition by concat(month,day,hour) order by ref_host_cnts desc) as od
from dw_pvs_refererhost_everyhour) t where od<=3;
2. 受访分析(从页面的角度分析)
2.1. 各页面访问统计
主要是针对数据中的request进行统计分析,比如各页面PV ,各页面UV 等。
以上指标无非就是根据页面的字段group by。例如:
--统计各页面pv
select request as request,count(request) as request_counts from
ods_weblog_detail group by request having request is not null order by request_counts desc limit 20;
2.2. 热门页面统计
--统计每日最热门的页面top10
drop table dw_hotpages_everyday;
create table dw_hotpages_everyday(day string,url string,pvs string);

insert into table dw_hotpages_everyday
select '20130918',a.request,a.request_counts from
(select request as request,count(request) as request_counts from ods_weblog_detail where datestr='20130918' group by request having request is not null) a
order by a.request_counts desc limit 10;
3. 访客分析
3.1. 独立访客
需求描述:按照时间维度比如小时来统计独立访客及其产生的pv。
对于独立访客的识别,如果在原始日志中有用户标识,则根据用户标识即很好实现;此处,由于原始日志中并没有用户标识,以访客IP来模拟,技术上是一样的,只是精确度相对较低。
--时间维度:时
drop table dw_user_dstc_ip_h;
create table dw_user_dstc_ip_h(
remote_addr string,
pvs      bigint,
hour     string);

insert into table dw_user_dstc_ip_h
select remote_addr,count(1) as pvs,concat(month,day,hour) as hour
from ods_weblog_detail
Where datestr='20130918'
group by concat(month,day,hour),remote_addr;
在此结果表之上,可以进一步统计,如每小时独立访客总数:
select count(1) as dstc_ip_cnts,hour from dw_user_dstc_ip_h group by hour;

--时间维度:日
select remote_addr,count(1) as counts,concat(month,day) as day
from ods_weblog_detail
Where datestr='20130918'
group by concat(month,day),remote_addr;

--时间维度:月
select remote_addr,count(1) as counts,month
from ods_weblog_detail
group by month,remote_addr;
3.2. 每日新访客
需求:将每天的新访客统计出来。
实现思路:创建一个去重访客累积表,然后将每日访客对比累积表。

–历日去重访客累积表
drop table dw_user_dsct_history;
create table dw_user_dsct_history(
day string,
ip string
)
partitioned by(datestr string);

--每日新访客表
drop table dw_user_new_d;
create table dw_user_new_d (
day string,
ip string
)
partitioned by(datestr string);

--每日新用户插入新访客表
insert into table dw_user_new_d partition(datestr='20130918')
select tmp.day as day,tmp.today_addr as new_ip from
(
select today.day as day,today.remote_addr as today_addr,old.ip as old_addr
from
(select distinct remote_addr as remote_addr,"20130918" as day from ods_weblog_detail where datestr="20130918") today
left outer join
dw_user_dsct_history old
on today.remote_addr=old.ip
) tmp
where tmp.old_addr is null;

--每日新用户追加到累计表
insert into table dw_user_dsct_history partition(datestr='20130918')
select day,ip from dw_user_new_d where datestr='20130918';
验证查看:
select count(distinct remote_addr) from ods_weblog_detail;

select count(1) from dw_user_dsct_history where datestr='20130918';

select count(1) from dw_user_new_d where datestr='20130918';
注:还可以按来源地域维度、访客终端维度等计算
4. 访客Visit分析(点击流模型)
4.1. 回头/单次访客统计
需求:查询今日所有回头访客及其访问次数。
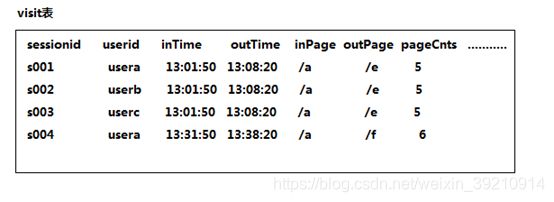
实现思路:上表中出现次数>1的访客,即回头访客;反之,则为单次访客。
drop table dw_user_returning;
create table dw_user_returning(
day string,
remote_addr string,
acc_cnt string)
partitioned by (datestr string);

insert overwrite table dw_user_returning partition(datestr='20130918')
select tmp.day,tmp.remote_addr,tmp.acc_cnt
from
(select '20130918' as day,remote_addr,count(session) as acc_cnt from ods_click_stream_visit group by remote_addr) tmp
where tmp.acc_cnt>1;
4.2. 人均访问频次
需求:统计出每天所有用户访问网站的平均次数(visit)
总visit数/去重总用户数
select count(pagevisits)/count(distinct remote_addr) from ods_click_stream_visit where datestr='20130918';

