20210512_25期_集成学习(下)_Task13_Stacking集成学习算法
十三、Stacking集成学习算法
目录
- 十三、Stacking集成学习算法
-
-
-
- 来源
-
- 13.1 Stacking集成原理及思路
- 13.2 Stacking代码实例
-
- 13.2.1 简单堆叠3折CV分类
- 13.2.2 简单堆叠3折CV分类
- 13.2.3 堆叠5折CV分类与网格搜索(结合网格搜索调参优化)
- 13.2.4 在不同特征子集上运行的分类器的堆叠
- 13.2.5 ROC曲线 decision_function
- 参考资料
-
来源
Datewhle24期__集成学习(下) :
https://github.com/datawhalechina/team-learning-data-mining/tree/master/EnsembleLearning
作者:李祖贤、薛传雨、赵可、杨毅远、陈琰钰
论坛地址:
http://datawhale.club/t/topic/1574
13.1 Stacking集成原理及思路
- 简单来说是个两层(最少)的学习过程:
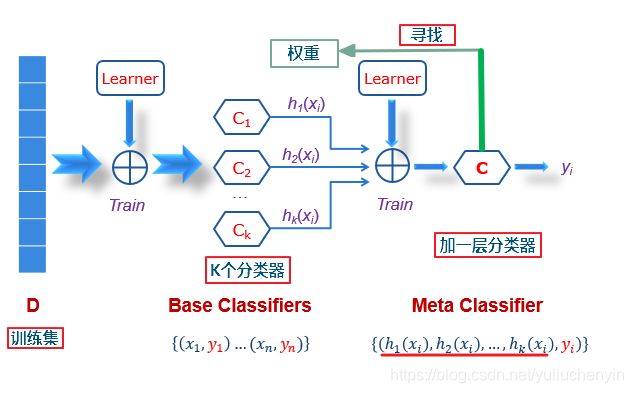
- stacking 就是当用初始训练数据学习出若干个基学习器后,将这几个学习器的预测结果作为新的训练集,来学习一个新的学习器。对不同模型预测的结果再进行建模。
- 基本思想:Stacking模型本质上是一种分层的结构,这里简单起见,只分析二级Stacking.假设我们有3个基模型M1、M2、M3。
-
基模型M1,对训练集train训练,然后对train和test预测,结果分别是P1,T1 ( ⋮ P 1 ⋮ ⋮ ) ( ⋮ T 1 ⋮ ⋮ ) \left(\begin{array}{c} \vdots \\ P_{1} \\ \vdots \\ \vdots \end{array}\right)\left(\begin{array}{c} \vdots \\ T_{1} \\ \vdots \\ \vdots \end{array}\right) ⎝⎜⎜⎜⎜⎜⎛⋮P1⋮⋮⎠⎟⎟⎟⎟⎟⎞⎝⎜⎜⎜⎜⎜⎛⋮T1⋮⋮⎠⎟⎟⎟⎟⎟⎞对于M2和M3,重复相同的工作,这样也得到P2,T2,P3,T3。
-
分别把P1,P2,P3以及T1,T2,T3合并,得到一个新的训练集和测试集train2,test2. ( ⋮ P 1 ⋮ ⋮ ) ( ⋮ P 2 ⋮ ⋮ ) ( ⋮ P 3 ⋮ ⋮ ) ⟹ ( ⋮ ⋮ ⋮ P 1 P 2 P 3 ⋮ ⋮ ⋮ ⋮ ⋮ ⋮ ) ⏞ train 2 \left(\begin{array}{c} \vdots \\ P_{1} \\ \vdots \\ \vdots \end{array}\right)\left(\begin{array}{c} \vdots \\ P_{2} \\ \vdots \\ \vdots \end{array}\right)\left(\begin{array}{c} \vdots \\ P_{3} \\ \vdots \\ \vdots \end{array}\right) \Longrightarrow \overbrace{\left(\begin{array}{ccc} \vdots & \vdots & \vdots \\ P_{1} & P_{2} & P_{3} \\ \vdots & \vdots & \vdots \\ \vdots & \vdots & \vdots \end{array}\right)}^{\text {train } 2} ⎝⎜⎜⎜⎜⎜⎛⋮P1⋮⋮⎠⎟⎟⎟⎟⎟⎞⎝⎜⎜⎜⎜⎜⎛⋮P2⋮⋮⎠⎟⎟⎟⎟⎟⎞⎝⎜⎜⎜⎜⎜⎛⋮P3⋮⋮⎠⎟⎟⎟⎟⎟⎞⟹⎝⎜⎜⎜⎜⎜⎛⋮P1⋮⋮⋮P2⋮⋮⋮P3⋮⋮⎠⎟⎟⎟⎟⎟⎞ train 2 ( ⋮ T 1 ⋮ ⋮ ) ( ⋮ T 2 ⋮ ⋮ ) ( ⋮ T 3 ⋮ ⋮ ) ⟹ ( ⋮ ⋮ ⋮ T 1 T 2 T 3 ⋮ ⋮ ⋮ ⋮ ⋮ ⋮ ) ⏞ test 2 \left(\begin{array}{c} \vdots \\ T_{1} \\ \vdots \\ \vdots \end{array}\right)\left(\begin{array}{c} \vdots \\ T_{2} \\ \vdots \\ \vdots \end{array}\right)\left(\begin{array}{c} \vdots \\ T_{3} \\ \vdots \\ \vdots \end{array}\right) \Longrightarrow \overbrace{\left(\begin{array}{ccc} \vdots & \vdots & \vdots \\ T_{1} & T_{2} & T_{3} \\ \vdots & \vdots & \vdots \\ \vdots & \vdots & \vdots \end{array}\right)}^{\text {test } 2} ⎝⎜⎜⎜⎜⎜⎛⋮T1⋮⋮⎠⎟⎟⎟⎟⎟⎞⎝⎜⎜⎜⎜⎜⎛⋮T2⋮⋮⎠⎟⎟⎟⎟⎟⎞⎝⎜⎜⎜⎜⎜⎛⋮T3⋮⋮⎠⎟⎟⎟⎟⎟⎞⟹⎝⎜⎜⎜⎜⎜⎛⋮T1⋮⋮⋮T2⋮⋮⋮T3⋮⋮⎠⎟⎟⎟⎟⎟⎞ test 23. 再用第二层的模型M4训练train2,预测test2,得到最终的标签列。
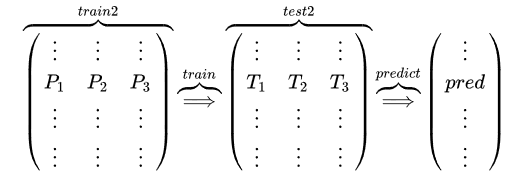
Stacking本质上就是这么直接的思路,但是这样肯定是不行的,问题在于P1的得到是有问题的,用整个训练集训练的模型反过来去预测训练集的标签,毫无疑问过拟合是非常非常严重的,因此现在的问题变成了如何在解决过拟合的前提下得到P1、P2、P3,这就变成了熟悉的节奏——K折交叉验证。
-
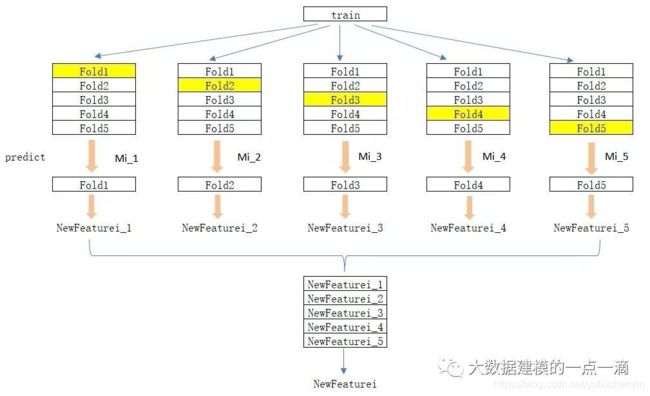
如果直接在训练数据集中对基学习器进行训练,然后用输出作为新特征,容易造成过拟合。所以为了减少过拟合的影响,可以采取K-Folds的方式生成新特征。如下图,以5-Folds为例,Mi为第i个基学习器。
-
(1)将训练数据集train随机等分为5份,分别为
Fold1~Fold5; -
(2)对i=1, 2, …,N:在
{Fold2, Fold3, Fold4, Fold5}上对Mi进行训练,得到学习器Mi_1,然后对Fold1进行预测,得到新特征在Fold1上的值NewFeaturei_1,以此类推,依次得到NewFeaturei_2-NewFeaturei_2,最后将NewFeaturei_1~NewFeaturei_5合并在一起,得到新特征NewFeaturei; -
(3)新特征组成了新的训练数据集
newtrain={NewFeature1, NewFeature2,...,NewFeatureN},作为下一层的训练数据集。
-
- Stacking融合(回归)例子
from sklearn import linear_model
def Stacking_method(train_reg1,train_reg2,train_reg3,   #sklearn没有Stacking
                    y_train_true,test_pre1,
                    test_pre2,test_pre3,
                   model_L2 = linear_model.LinearRegression()):
    model_L2.fit(pd.concat([pd.Series(train_reg1),pd.Series(train_reg2),
                           pd.Series(train_reg3)],axis = 1).values,y_train_true)
    Stacking_result = model_L2.predict(pd.concat([pd.Series(test_pre1),pd.Series(test_pre2),pd.Series(test_pre3)],axis=1).values)
    return Stacking_result

## 生成一些简单的样本数据,test_prei 代表第i个模型的预测值
train_reg1 = [3.2, 8.2, 9.1, 5.2]
train_reg2 = [2.9, 8.1, 9.0, 4.9]
train_reg3 = [3.1, 7.9, 9.2, 5.0]
# y_test_true 代表第模型的真实值
y_train_true = [3, 8, 9, 5]

test_pre1 = [1.2, 3.2, 2.1, 6.2]
test_pre2 = [0.9, 3.1, 2.0, 5.9]
test_pre3 = [1.1, 2.9, 2.2, 6.0]

# y_test_true 代表第模型的真实值
y_test_true = [1, 3, 2, 6]

model_L2= linear_model.LinearRegression()
Stacking_pre = Stacking_method(train_reg1,train_reg2,train_reg3,y_train_true,
                               test_pre1,test_pre2,test_pre3,model_L2)
print('Stacking_pre MAE:',metrics.mean_absolute_error(y_test_true, Stacking_pre))
Stacking_pre MAE: 0.04213483146067476
13.2 Stacking代码实例
- 由于sklearn并没有直接对Stacking的方法,因此我们需要下载mlxtend工具包(pip install mlxtend)
!pip install mlxtend -i https://mirrors.aliyun.com/pypi/simple/
13.2.1 简单堆叠3折CV分类
- 导入库
from sklearn import datasets
from sklearn.model_selection import cross_val_score   # CV
from sklearn.linear_model import LogisticRegression   #LR模型
from sklearn.neighbors import KNeighborsClassifier    # KNN模型
from sklearn.naive_bayes import GaussianNB           #高斯朴素贝叶斯
from sklearn.ensemble import RandomForestClassifier  # 随机森林
from mlxtend.classifier import StackingCVClassifier    # Stacking
# 准备数据集 及学习模型
RANDOM_SEED = 42
iris = datasets.load_iris()
X, y = iris.data[:, 1:3], iris.target
clf1 = KNeighborsClassifier(n_neighbors=1)
clf2 = RandomForestClassifier(random_state=RANDOM_SEED)
clf3 = GaussianNB()
lr = LogisticRegression()
sclf = StackingCVClassifier(classifiers=[clf1, clf2, clf3],  # 第一层分类器
                            meta_classifier=lr,   # 第二层分类器
                            random_state=RANDOM_SEED)

print('3-fold cross validation:\n')

for clf, label in zip([clf1, clf2, clf3, sclf], ['KNN', 'Random Forest', 'Naive Bayes','StackingClassifier']):
    scores = cross_val_score(clf, X, y, cv=3, scoring='accuracy')
    print("Accuracy: %0.2f (+/- %0.2f) [%s]" % (scores.mean(), scores.std(), label))
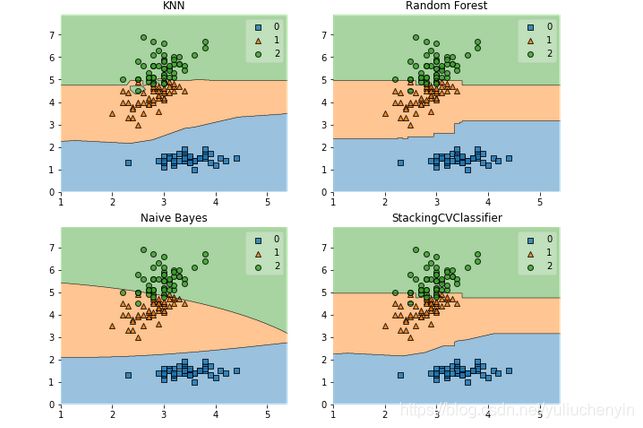
- 可以看出3折Stacking 反向学习 , 比随机森林效果更差
#决策边界
from mlxtend.plotting import plot_decision_regions
import matplotlib.gridspec as gridspec
import itertools

gs = gridspec.GridSpec(2, 2)
fig = plt.figure(figsize=(10,8))
for clf, lab, grd in zip([clf1, clf2, clf3, sclf],
                         ['KNN',
                          'Random Forest',
                          'Naive Bayes',
                          'StackingCVClassifier'],
                          itertools.product([0, 1], repeat=2)):
    clf.fit(X, y)
    ax = plt.subplot(gs[grd[0], grd[1]])
    fig = plot_decision_regions(X=X, y=y, clf=clf)
    plt.title(lab)
plt.show()
13.2.2 简单堆叠3折CV分类
- 平均基分类器概率
使用第一层所有基分类器所产生的类别概率值作为meta-classfier的输入。需要在StackingClassifier 中增加一个参数设置:use_probas = True。
另外,还有一个参数设置average_probas = True,那么这些基分类器所产出的概率值将按照列被平均,否则会拼接。
例如:
基分类器1:predictions=[0.2,0.2,0.7]
基分类器2:predictions=[0.4,0.3,0.8]
基分类器3:predictions=[0.1,0.4,0.6]
1)若use_probas = True,average_probas = True,
则产生的meta-feature 为:[0.233, 0.3, 0.7]
2)若use_probas = True,average_probas = False,
则产生的meta-feature 为:[0.2,0.2,0.7,0.4,0.3,0.8,0.1,0.4,0.6]
clf1 = KNeighborsClassifier(n_neighbors=1)
clf2 = RandomForestClassifier(random_state=1)
clf3 = GaussianNB()
lr = LogisticRegression()

sclf = StackingCVClassifier(classifiers=[clf1, clf2, clf3],
                            use_probas=True,  # se_probas = True,average_probas = True,

则产生的meta-feature 为:[0.233, 0.3, 0.7]
                            meta_classifier=lr,
                            random_state=42)

print('3-fold cross validation:\n')

for clf, label in zip([clf1, clf2, clf3, sclf],
                      ['KNN',
                       'Random Forest',
                       'Naive Bayes',
                       'StackingClassifier']):

    scores = cross_val_score(clf, X, y,
                                              cv=3, scoring='accuracy')
    print("Accuracy: %0.2f (+/- %0.2f) [%s]"
          % (scores.mean(), scores.std(), label))
13.2.3 堆叠5折CV分类与网格搜索(结合网格搜索调参优化)
- 分类
from sklearn.linear_model import LogisticRegression
from sklearn.neighbors import KNeighborsClassifier
from sklearn.naive_bayes import GaussianNB
from sklearn.ensemble import RandomForestClassifier
from sklearn.model_selection import GridSearchCV
from mlxtend.classifier import StackingCVClassifier

# Initializing models

clf1 = KNeighborsClassifier(n_neighbors=1)
clf2 = RandomForestClassifier(random_state=RANDOM_SEED)
clf3 = GaussianNB()
lr = LogisticRegression()

sclf = StackingCVClassifier(classifiers=[clf1, clf2, clf3],
                            meta_classifier=lr,
                            random_state=42)

params = {
     'kneighborsclassifier__n_neighbors': [1, 5],
          'randomforestclassifier__n_estimators': [10, 50],
          'meta_classifier__C': [0.1, 10.0]}

grid = GridSearchCV(estimator=sclf,
                    param_grid=params,
                    cv=5,
                    refit=True)
grid.fit(X, y)

cv_keys = ('mean_test_score', 'std_test_score', 'params')

for r, _ in enumerate(grid.cv_results_['mean_test_score']):
    print("%0.3f +/- %0.2f %r"
          % (grid.cv_results_[cv_keys[0]][r],
             grid.cv_results_[cv_keys[1]][r] / 2.0,
             grid.cv_results_[cv_keys[2]][r]))

print('Best parameters: %s' % grid.best_params_)
print('Accuracy: %.2f' % grid.best_score_)
- 回归;在参数网格中添加一个附加的数字后缀
from sklearn.model_selection import GridSearchCV

# Initializing models

clf1 = KNeighborsClassifier(n_neighbors=1)
clf2 = RandomForestClassifier(random_state=RANDOM_SEED)
clf3 = GaussianNB()
lr = LogisticRegression()

sclf = StackingCVClassifier(classifiers=[clf1, clf1, clf2, clf3],
                            meta_classifier=lr,
                            random_state=RANDOM_SEED)

params = {
     'kneighborsclassifier-1__n_neighbors': [1, 5],
          'kneighborsclassifier-2__n_neighbors': [1, 5],
          'randomforestclassifier__n_estimators': [10, 50],
          'meta_classifier__C': [0.1, 10.0]}

grid = GridSearchCV(estimator=sclf,
                    param_grid=params,
                    cv=5,
                    refit=True)
grid.fit(X, y)

cv_keys = ('mean_test_score', 'std_test_score', 'params')

for r, _ in enumerate(grid.cv_results_['mean_test_score']):
    print("%0.3f +/- %0.2f %r"
          % (grid.cv_results_[cv_keys[0]][r],
             grid.cv_results_[cv_keys[1]][r] / 2.0,
             grid.cv_results_[cv_keys[2]][r]))

print('Best parameters: %s' % grid.best_params_)
print('Accuracy: %.2f' % grid.best_score_)
13.2.4 在不同特征子集上运行的分类器的堆叠
##不同的1级分类器可以适合训练数据集中的不同特征子集。以下示例说明了如何使用scikit-learn管道和ColumnSelector:
from sklearn.datasets import load_iris
from mlxtend.classifier import StackingCVClassifier
from mlxtend.feature_selection import ColumnSelector
from sklearn.pipeline import make_pipeline
from sklearn.linear_model import LogisticRegression

iris = load_iris()
X = iris.data
y = iris.target

pipe1 = make_pipeline(ColumnSelector(cols=(0, 2)),  # 选择第0,2列
                      LogisticRegression())
pipe2 = make_pipeline(ColumnSelector(cols=(1, 2, 3)),  # 选择第1,2,3列
                      LogisticRegression())

sclf = StackingCVClassifier(classifiers=[pipe1, pipe2],
                            meta_classifier=LogisticRegression(),
                            random_state=42)

sclf.fit(X, y)
13.2.5 ROC曲线 decision_function
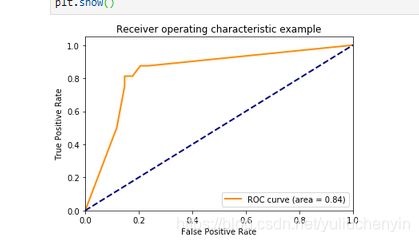
### 像其他scikit-learn分类器一样,它StackingCVClassifier具有decision_function可用于绘制ROC曲线的方法。
### 请注意,decision_function期望并要求元分类器实现decision_function。
from sklearn import model_selection
from sklearn.linear_model import LogisticRegression
from sklearn.neighbors import KNeighborsClassifier
from sklearn.svm import SVC
from sklearn.ensemble import RandomForestClassifier
from mlxtend.classifier import StackingCVClassifier
from sklearn.metrics import roc_curve, auc
from sklearn.model_selection import train_test_split
from sklearn import datasets
from sklearn.preprocessing import label_binarize
from sklearn.multiclass import OneVsRestClassifier

iris = datasets.load_iris()
X, y = iris.data[:, [0, 1]], iris.target

# Binarize the output
y = label_binarize(y, classes=[0, 1, 2])
n_classes = y.shape[1]

RANDOM_SEED = 42

X_train, X_test, y_train, y_test = train_test_split(
    X, y, test_size=0.33, random_state=RANDOM_SEED)

clf1 =  LogisticRegression()
clf2 = RandomForestClassifier(random_state=RANDOM_SEED)
clf3 = SVC(random_state=RANDOM_SEED)
lr = LogisticRegression()

sclf = StackingCVClassifier(classifiers=[clf1, clf2, clf3],
                            meta_classifier=lr)

# Learn to predict each class against the other
classifier = OneVsRestClassifier(sclf)
y_score = classifier.fit(X_train, y_train).decision_function(X_test)

# Compute ROC curve and ROC area for each class
fpr = dict()
tpr = dict()
roc_auc = dict()
for i in range(n_classes):
    fpr[i], tpr[i], _ = roc_curve(y_test[:, i], y_score[:, i])
    roc_auc[i] = auc(fpr[i], tpr[i])

# Compute micro-average ROC curve and ROC area
fpr["micro"], tpr["micro"], _ = roc_curve(y_test.ravel(), y_score.ravel())
roc_auc["micro"] = auc(fpr["micro"], tpr["micro"])

plt.figure()
lw = 2
plt.plot(fpr[2], tpr[2], color='darkorange',
         lw=lw, label='ROC curve (area = %0.2f)' % roc_auc[2])
plt.plot([0, 1], [0, 1], color='navy', lw=lw, linestyle='--')
plt.xlim([0.0, 1.0])
plt.ylim([0.0, 1.05])
plt.xlabel('False Positive Rate')
plt.ylabel('True Positive Rate')
plt.title('Receiver operating characteristic example')
plt.legend(loc="lower right")
plt.show()
参考资料
- https://cloud.tencent.com/developer/article/1614539模型融合
- https://cloud.tencent.com/developer/article/1463294模型融合-Stacking&Blending
