Echart3图越来越强大,最近公司有这样的需求,客户对界面要求比较高,专门设计了几种图,查阅了官网的使用API。算是实现了吧!
背景有方格子的图
option = {
title: {
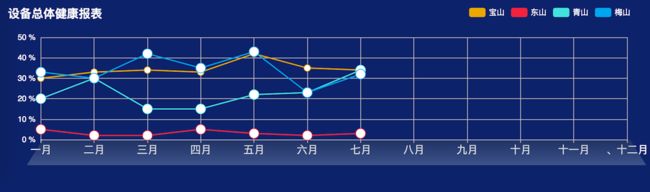
text: "设备总体健康报表",
textStyle: {
color: "#ffffff",
fontWeight: 'bold'
},
left: "10",
top: '10'
},
tooltip: {
trigger: 'axis'
},
color: ['#e8b609', '#e74e54', '#79e4e4', '#29b4ec'],
grid: {
left: '3%',
right: '4%',
bottom: '20%',
containLabel: true,
},
legend: {
right: '30',
top: '10',
orient: 'horizontal',
textStyle: {
color: '#ffffff'
},
icon: 'roundRect',
data: ['宝山', '东山', '青山', '梅山']
},
xAxis: {
type: 'category',
boundaryGap: false,
nameTextStyle: {
fontSize: '16'
},
axisLabel: {
height: '50',
textStyle: {
color: '#ffffff',
fontSize: '16'
}
},
splitLine: {
show: true,
lineStyle: {
type: 'solid'
}
},
axisLine: {
lineStyle: {
color: '#ffffff'
}
},
data: ['一月', '二月', '三月', '四月', '五月', '六月', '七月', '八月', '九月', '十月', '十一月', '、十二月']
},
yAxis: {
type: 'value',
axisLine: true,
axisLabel: {
formatter: '{value} %',
textStyle: {
color: '#ffffff'
}
}
},
series: [
{
name: '宝山',
type: 'line',
symbolSize: 10,
data: [30, 33, 34, 33, 42, 35, 34]
},
{
name: '东山',
type: 'line',
symbolSize: 15,
data: [5, 2, 2, 5, 3, 2, 3],
},
{
name: '青山',
type: 'line',
symbolSize: 15,
data: [20, 30, 15, 15, 22, 23, 34],
},
{
name: '梅山',
type: 'line',
symbolSize: 15,
data: [33, 30, 42, 35, 43, 23, 32],
}
],
graphic: [
{
type: 'image',
id: 'logo',
right: '11',
bottom: '28%',
z: 1000,
bounding: 'raw',
style: {
image: 'image/shadow.png',
width: 945
}
}
],
};
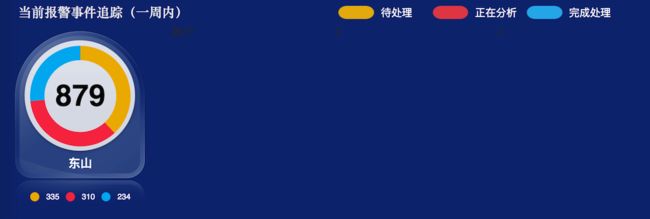
有一个背景图的渐变色饼图

     option = {
        tooltip: {
            trigger: 'item',
            formatter: "{a}
{b}: {c} ({d}%)"
        },
        color: ['#e8b609', '#e74e54', '#29b4ec'],
        grid: {
            top: 'top'
        },
        legend: {
            left: 'center',
            top: '30',
            orient: 'vertical',
            textStyle: {
                color: '#ffffff',
                fontSize: '20',
                verticalAlign: 'bottom'
            },
            itemHeight: '50',
            icon: 'rect',
            data: ['335', '310', '234'],
            formatter: function (name) {
                return "指标名称\n" + name;
            }
        },
        graphic: [
            {
                type: 'image',
                left: '32',
                top: 8,
                z: -10,
                bounding: 'raw',
                style: {
                    image: 'image/circle_equipment.png',
                    width: 200,
//                    height: 150,
//                    opacity: 0.4
                }
            }


        ],
        series: [
            {
                name: '访问来源',
                type: 'pie',
                radius: ['30%', '60%'],
                center: ['22%', '36%'],
                avoidLabelOverlap: false,
                label: {
                    normal: {
                        show: false,
                        position: 'center'
                    },
                    emphasis: {
                        show: true,
                        textStyle: {
                            fontSize: '30',
                            fontWeight: 'bold'
                        }
                    }
                },
                labelLine: {
                    normal: {
                        show: false
                    }
                },
                data: [
                    {
                        value: 335,
                        name: '335',
                        itemStyle: {
                            normal: {
                                color: new echarts.graphic.LinearGradient(0, 0, 0, 1, [{
                                    offset: 0,
                                    color: '#fcd661'
                                }, {
                                    offset: 1,
                                    color: '#fca81f'
                                }])
                            }
                        }

                    },
                    {
                        value: 310,
                        name: '310',
                        itemStyle: {
                            normal: {
                                color: new echarts.graphic.LinearGradient(0, 0, 0, 1, [{
                                    offset: 0,
                                    color: '#48e4c1'
                                }, {
                                    offset: 1,
                                    color: '#15aa97'
                                }])
                            }
                        }
                    },
                    {
                        value: 234,
                        name: '234',
                        itemStyle: {
                            normal: {
                                color: new echarts.graphic.LinearGradient(0, 0, 0, 1, [{
                                    offset: 0,
                                    color: '#2cc1ff'
                                }, {
                                    offset: 1,
                                    color: '#148ccb'
                                }])
                            }
                        }
                    }
                ]
            }
        ]
    };
默认展示数据的饼图
    option = {
        title: {
            text: "东山",
            textStyle: {
                color: "#ffffff",
            },
            left: "center",
            bottom: "75"
        },
        tooltip: {
            trigger: 'item',
            formatter: "{a}
{b}: {c} ({d}%)"
        },
        color: ['#e8b609', '#e74e54', '#29b4ec'],
        grid: {
            top: 'top'
        },
        legend: {
            left: 'center',
            bottom: '26',
            orient: 'horizontal',
            textStyle: {
                color: '#ffffff'
            },
            icon: 'circle',
            data: ['335', '310', '234'],


        },
        graphic: [
            {
                type: 'image',
                id: 'logo',
                right: 11,
                top: 8,
                z: -10,
                bounding: 'raw',
                style: {
                    image: 'image/circlebg.png',
                    width: 200,
//                    height: 150,
//                    opacity: 0.4
                }
            }


        ],
        series: [
            {
                name: '访问来源',
                type: 'pie',
                radius: ['50%', '70%'],
                center: ['50%', '36%'],
                avoidLabelOverlap: false,
                label: {
                    normal: {
                        show: false,
                        position: 'center',
                        formatter: function (params) {
//                            if (params.name == "335") {
//                            }
//                            return "";
//                        return params.value + '\n' + params.name;
                        },
                    },

                    emphasis: {
                        show: false,
                        textStyle: {
                            fontSize: '30',
                            fontWeight: 'bold'
                        }
                    }

                },
                labelLine: {
                    normal: {
                        show: false
                    }
                },
                data: [
                    {value: 335, name: '335'},
                    {value: 310, name: '310'},
                    {value: 234, name: '234'}
                ]
            }, {
                name: '完成处理',
                type: 'pie',
                clockWise: false,
                hoverAnimation: true,
                radius: ['50', '50'],
                center: ['50%', '36%'],
                label: {
                    normal: {
                        position: 'center'
                    }
                },
                tooltip: {
                    show: false
                },
                data: [
                    {
                        label: {
                            normal: {
                                formatter: '879',
                                textStyle: {
                                    color: '#000000',
                                    fontSize: 46,
                                    fontWeight: 'bold'
                                }
                            }
                        }
                    }
                ]
            }
        ]
    };