k-means聚类算法及其优化
欢迎关注笔者的微信公众号
![]()
在机器学习中有这样一种场景,需要对已知数据按照一定的关系归到不同的类别中(无监督)
k-means是比较流行的聚类方法
其基本算法流程如下:
- 随机设置K个特征空间内的点作为初始的聚类中心
- 对于其他每个点计算到K个中心的距离,未知的点选择最近的一个聚类中心点作为标记类别
- 接着对着标记的聚类中心之后,重新计算出每个聚类的新中心点(平均值)
- 如果计算得出的新中心点与原中心点一样(质心不再移动),那么结束,否则重新进行第二步过程
# Author: Phil Roth 
k-means算法的一个缺点是它对质心或均值的初始化很敏感。如果聚类的质心点选择不当,最终会导致聚类的质量非常糟糕。
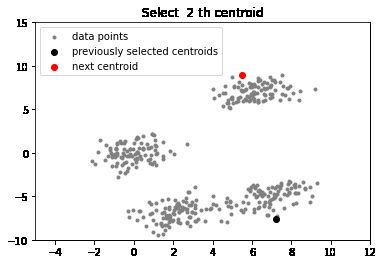
k-means++是对k-means质心初始化的一个优化。相比于k-means,k-means++不同之处在于质心点的选择。
初始化聚类中心时的基本原则是使聚类中心之间的相互距离尽可能的远。
基本算法流程:
- 在数据集中随机选择一个样本作为第一个初始化聚类中心;
- 计算样本中每一个样本点与已经初始化的聚类中心的距离,并选择其中最短的距离;
- 以概率选择距离最大的点作为新的聚类中心;
- 重复2、3步直至选出k个聚类中心;
- 对k个聚类中心使用K-Means算法计算最终的聚类结果。
重点在于初始质心点选择,其余步骤跟标准k-means算法相同
这里给一个k-means++算法的实现:
# importing dependencies
import numpy as np
import pandas as pd
import matplotlib.pyplot as plt
import sys

# creating data
mean_01 = np.array([0.0, 0.0])
cov_01 = np.array([[1, 0.3], [0.3, 1]])
dist_01 = np.random.multivariate_normal(mean_01, cov_01, 100)

mean_02 = np.array([6.0, 7.0])
cov_02 = np.array([[1.5, 0.3], [0.3, 1]])
dist_02 = np.random.multivariate_normal(mean_02, cov_02, 100)

mean_03 = np.array([7.0, -5.0])
cov_03 = np.array([[1.2, 0.5], [0.5, 1,3]])
dist_03 = np.random.multivariate_normal(mean_03, cov_01, 100)

mean_04 = np.array([2.0, -7.0])
cov_04 = np.array([[1.2, 0.5], [0.5, 1,3]])
dist_04 = np.random.multivariate_normal(mean_04, cov_01, 100)

data = np.vstack((dist_01, dist_02, dist_03, dist_04))
np.random.shuffle(data)

# function to plot the selected centroids
def plot(data, centroids):
	plt.scatter(data[:, 0], data[:, 1], marker = '.',
				color = 'gray', label = 'data points')
	plt.scatter(centroids[:-1, 0], centroids[:-1, 1],
				color = 'black', label = 'previously selected centroids')
	plt.scatter(centroids[-1, 0], centroids[-1, 1],
				color = 'red', label = 'next centroid')
	plt.title('Select % d th centroid'%(centroids.shape[0]))

	plt.legend()
	plt.xlim(-5, 12)
	plt.ylim(-10, 15)
	plt.show()

# function to compute euclidean distance
def distance(p1, p2):
	return np.sum((p1 - p2)**2)

# initialization algorithm
def initialize(data, k):
	'''
	initialized the centroids for K-means++
	inputs:
		data - numpy array of data points having shape (200, 2)
		k - number of clusters
	'''
	## initialize the centroids list and add
	## a randomly selected data point to the list
	centroids = []
	centroids.append(data[np.random.randint(
			data.shape[0]), :])
	plot(data, np.array(centroids))

	## compute remaining k - 1 centroids
	for c_id in range(k - 1):

		## initialize a list to store distances of data
		## points from nearest centroid
		dist = []
		for i in range(data.shape[0]):
			point = data[i, :]
			d = sys.maxsize

			## compute distance of 'point' from each of the previously
			## selected centroid and store the minimum distance
			for j in range(len(centroids)):
				temp_dist = distance(point, centroids[j])
				d = min(d, temp_dist)
			dist.append(d)

		## select data point with maximum distance as our next centroid
		dist = np.array(dist)
		next_centroid = data[np.argmax(dist), :]
		centroids.append(next_centroid)
		dist = []
		plot(data, np.array(centroids))
	return centroids

# call the initialize function to get the centroids
centroids = initialize(data, k = 4)
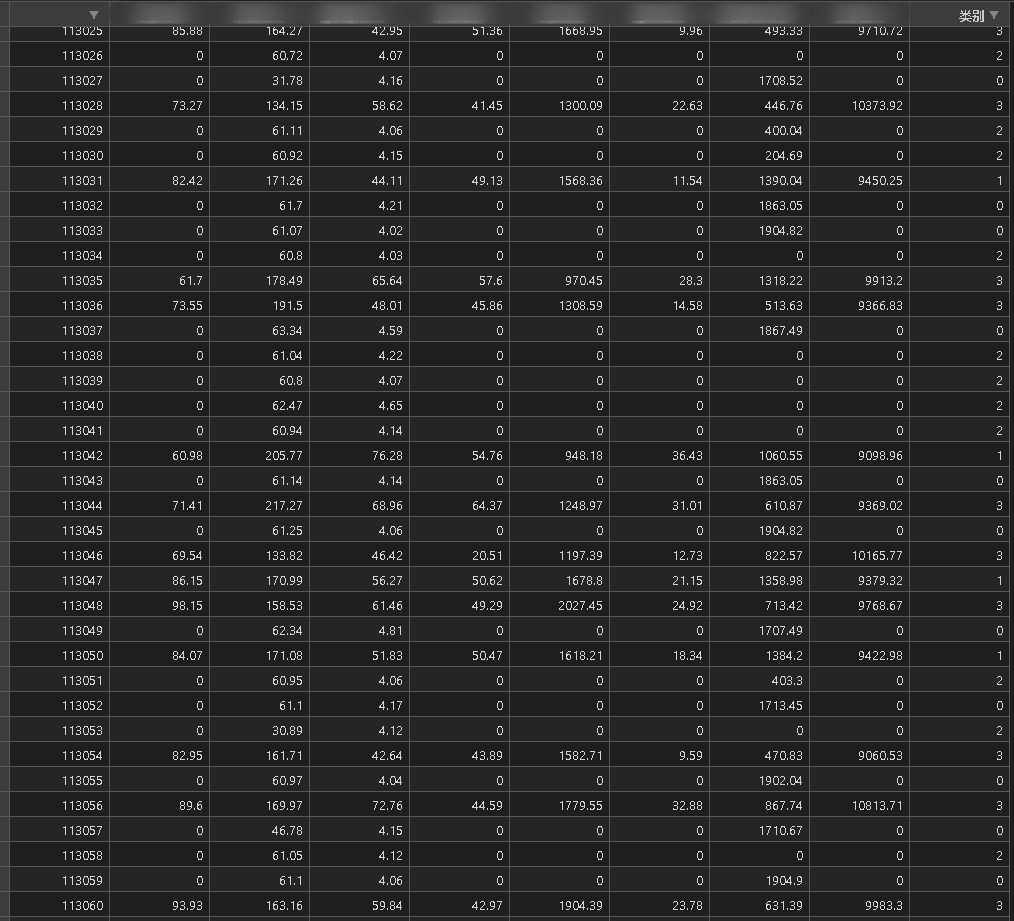
实验室最近刚好需要用到k-means算法分析一些数据,团队成员已经将数据处理过了,我的任务就是使用k-means++算法将数据分类。
研究了好几天,终于找到了k-means++的实现,想着怎么融合进sklearn的k-means(sklearn.cluster.KMeans)中。猜测应该会有一些参数让用户提供初始化的方法,然后去查看官方文档:
其实啥都不用做,三行代码就能搞定。。
from sklearn.cluster import KMeans
# x3是队友处理好的数据
y_pred = KMeans(n_clusters=4).fit_predict(x3)
x3.insert(x3.shape[1], '类别', y_pred))
x3.to_csv('data_label.csv')
吃一堑,长一智。以后啥事先看官方文档!
参考资料
- https://scikit-learn.org/stable/modules/generated/sklearn.cluster.KMeans.html#sklearn.cluster.KMeans
- https://www.geeksforgeeks.org/ml-k-means-algorithm/


