read unrate.csv into DataFrame and assign to unrate
Use Pandas.to_datetime to convert the DATE column into a Series of datetime values.
-
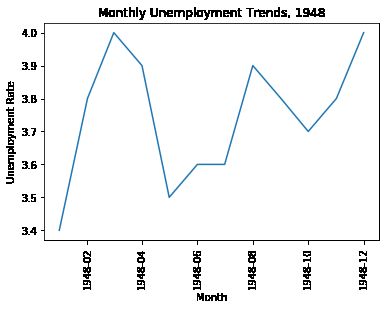
Generate a line chart that visualizes the unemployment rates from 1948:
- x-values should be the first 12 values in the DATE column
- y-values should be the first 12 values in the VALUE column
Use pyplot.xticks() to rotate the x-axis tick labels by 90 degrees.
Use pyplot.xlabel() to set the x-axis label to "Month".
Use pyplot.ylabel() to set the y-axis label to "Unemployment Rate".
Use pyplot.title() to set the plot title to "Monthly Unemployment Trends, 1948".
Display the plot.
import pandas as pd
import matplotlib.pyplot as plt

unrate = pd.read_csv('unrate.csv')
unrate['DATE'] = pd.to_datetime(unrate['DATE'])
plt.plot(unrate['DATE'][:12],unrate['VALUE'][:12])
plt.xticks(rotation = 90)
plt.xlabel('Month')
plt.ylabel('Unemployment Rate')
plt.title('Monthly Unemployment Trends, 1948')

plt.show()
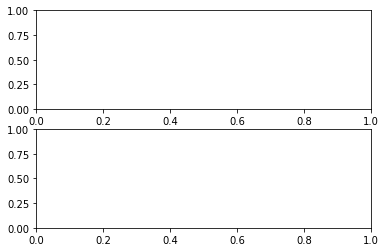
# axes_obj = fig.add_subplot(nrows, ncols, plot_number)
fig = plt.figure()
ax1 = fig.add_subplot(2,1,1)
ax2 = fig.add_subplot(2,1,2)
plt.show()
adding data
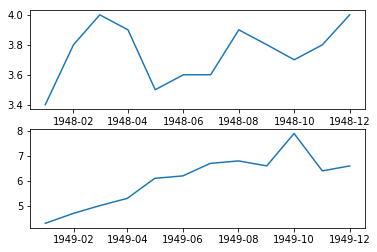
Create 2 line subplots in a 2 row by 1 column layout:
- In the top subplot, plot the data from 1948.
- For the x-axis, use the first 12 values in the DATE column.
- For the y-axis, use the first 12 values in the VALUE column.
- In the bottom subplot, plot the data from 1949.
- For the x-axis, use the values from index 12 to 24 in the DATE column.
- For the y-axis, use the values from index 12 to 24 in the VALUE column. Use plt.show() to display all the plots.
fig = plt.figure()
ax1 = fig.add_subplot(2,1,1)
ax2 = fig.add_subplot(2,1,2)
ax1.plot(unrate[0:12]['DATE'], unrate[0:12]['VALUE'])
ax2.plot(unrate[12:24]['DATE'], unrate[12:24]['VALUE'])

plt.show()
formatting and spacing
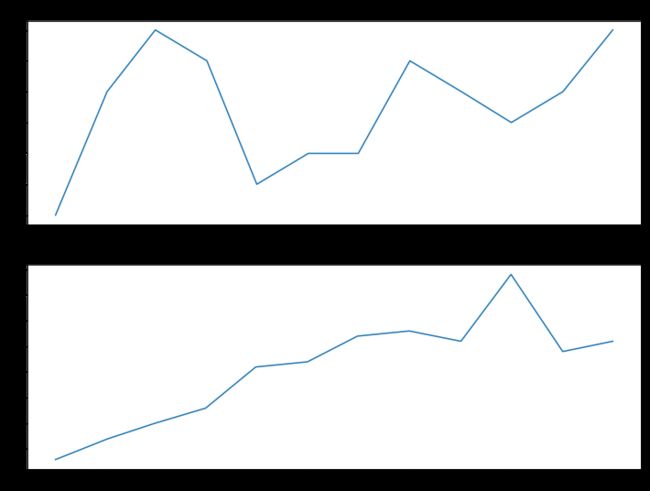
For the plot we generated in the last screen, set the width of the plotting area to 12 inches and the height to 9 inches.
#ig = plt.figure(figsize=(width, height))
fig = plt.figure(figsize = (12,9))
ax1 = fig.add_subplot(2,1,1)
ax2 = fig.add_subplot(2,1,2)

ax1.plot(unrate['DATE'][:12],unrate['VALUE'][:12])
ax2.plot(unrate['DATE'][12:24],unrate['VALUE'][12:24])

ax1.set_title('Monthly Unemployment Rate, 1948')
ax2.set_title('Monthly Unemployment Rate, 1949')

plt.show()
compraring across more years
- Set the width of the plotting area to 12 inches and the height to 12 inches.
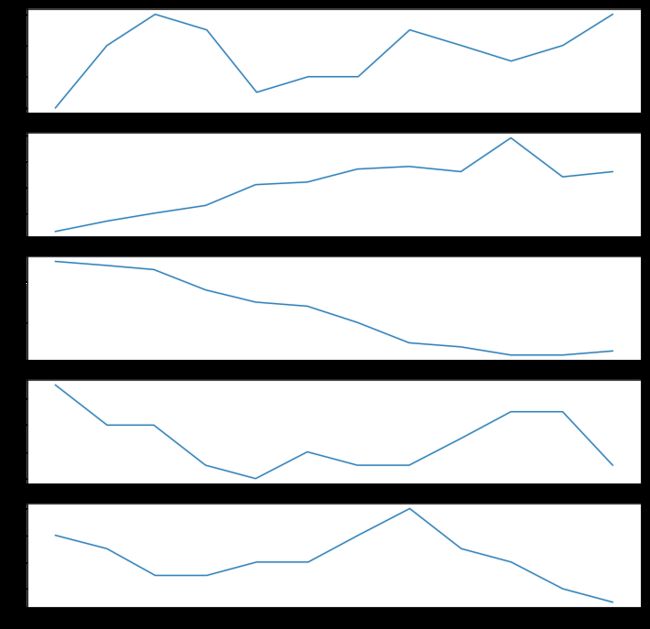
- Generate a grid with 5 rows and 1 column and plot data from the individual years. Start with 1948 in the top subplot and end with 1952 in the bottom subplot.
- Use plt.show() to display the plots.
fig = plt.figure(figsize= (12,12))

for i in range(5):
    ax = fig.add_subplot(5,1,i+1)

    #start_index
    s_i = i * 12
    #end_index
    e_i = (i+1) * 12

    subset = unrate[s_i:e_i]
    ax.plot(subset['DATE'], subset['VALUE'])

plt.show()
overlaying line charts
We can handle the visual overhead each additional plot adds by overlaying the line charts in a single subplot. If we remove the year from the x-axis and just keep the month values, we can use the same x-axis values to plot all of the lines. First, we'll explore how to extract just the month values from the DATEcolumn, then we'll dive into generating multiple plots on the same coordinate grid.
To extract the month values from the DATE column and assign them to a new column, we can use the pandas.Series.dt accessor:
- unrate['MONTH'] = unrate['DATE'].dt.month
- Calling pandas.Series.dt.month returns a Series containing the integer values for each month
- Under the hood, pandas applies the datetime.date function over each datetime value in the DATE column, which returns the integer month value. we called pyplot.plot() to generate a single line chart.
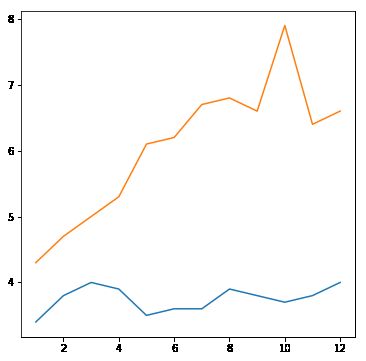
unrate['MONTH'] = unrate['DATE'].dt.month
fig = plt.figure(figsize=(6,6))
plt.plot(unrate[0:12]['MONTH'], unrate[0:12]['VALUE'])
plt.plot(unrate[12:24]['MONTH'], unrate[12:24]['VALUE'])
plt.show()
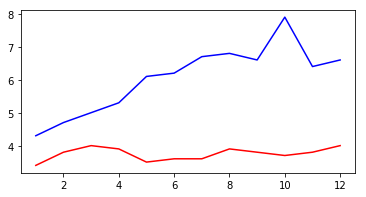
unrate['MONTH'] = unrate['DATE'].dt.month
fig = plt.figure(figsize=(6,3))
plt.plot(unrate[12:24]['MONTH'], unrate[12:24]['VALUE'], c = 'blue')
plt.plot(unrate[0:12]['MONTH'], unrate[0:12]['VALUE'], c='red')
plt.show()
Adding More Lines
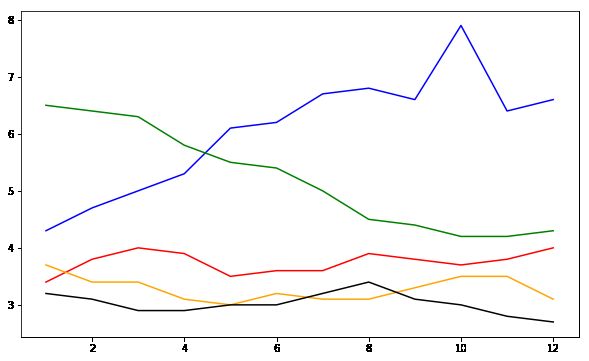
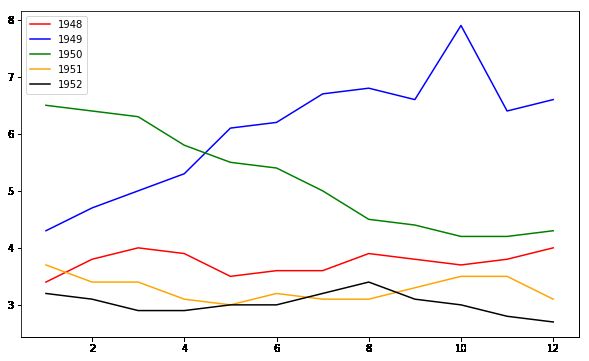
- Set the plotting area to a width of 10 inches and a height of 6 inches.
- Generate the following plots in the base subplot:
- 1948: set the line color to "red"
- 1949: set the line color to "blue"
- 1950: set the line color to "green"
- 1951: set the line color to "orange"
- 1952: set the line color to "black"
- Use plt.show() to display the plots
fig = plt.figure(figsize=(10,6))
colors = ['red','blue','green','orange','black']
for i in range(5):
    start_index = i*12
    end_index =(i+1)*12
    subset = unrate[start_index:end_index]
    plt.plot(subset['MONTH'],subset['VALUE'], c = colors[i])
plt.show()
adding a legend
When we generate each line chart, we need to specify the text label we want each color linked to. The pyplot.plot() function contains a label parameter, which we use to set the year value:
plt.plot(unrate[0:12]['MONTH'], unrate[0:12]['VALUE'], c='red', label='1948')
plt.plot(unrate[12:24]['MONTH'], unrate[12:24]['VALUE'], c='blue', label='1949')
-
Modify the code from the last screen that overlaid 5 plots to include a legend. Use the year value for each line chart as the label.
- E.g. the plot of 1948 data that uses "red" for the line color should be labeled "1948" in the legend.
Place the legend in the "upper left" corner of the plot.
Display the plot using plt.show().
fig = plt.figure(figsize=(10,6))
colors = ['red', 'blue', 'green', 'orange', 'black']
for i in range(5):
    start_index = i*12
    end_index = (i+1)*12
    subset = unrate[start_index:end_index]
    lables = str(1948+i)
    plt.plot(subset['MONTH'], subset['VALUE'],
             c=colors[i],label = lables)

plt.legend(loc ='upper left' )
plt.show()
final tweaks
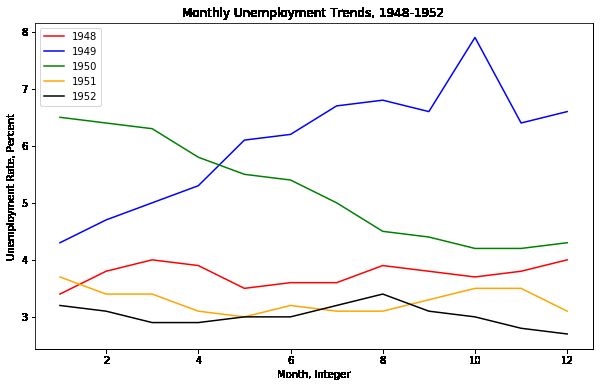
Modify the code from the last screen:
- Set the title to "Monthly Unemployment Trends, 1948-1952".
- Set the x-axis label to "Month, Integer".
- Set the y-axis label to "Unemployment Rate, Percent".
plt.show()
fig = plt.figure(figsize=(10,6))
colors = ['red', 'blue', 'green', 'orange', 'black']
for i in range(5):
    start_index = i*12
    end_index = (i+1)*12
    subset = unrate[start_index:end_index]
    label = str(1948 + i)
    plt.plot(subset['MONTH'], subset['VALUE'], c=colors[i], label=label)
plt.legend(loc='upper left')
plt.xlabel('Month, Integer')
plt.ylabel('Unemployment Rate, Percent')
plt.title('Monthly Unemployment Trends, 1948-1952')

plt.show()
