DataWhale集成学习笔记(九)Stacking集成算法
Stacking集成算法
- 1 Blending集成学习算法
-
- 1.1 算法流程
- 1.2 代码实例
- 2 Stacking集成算法
-
- 2.1 算法流程
- 2.2 代码实例
Stacking集成算法可以理解为一个两层的集成,第一层含有多个基础分类器,把预测的结果(元特征)提供给第二层, 而第二层的分类器通常是逻辑回归,他把一层分类器的结果当做特征做拟合输出预测结果。
1 Blending集成学习算法
Blending集成学习算法是一种简化版的Stacking集成算法。
1.1 算法流程
Blending集成学习的算法流程:
- 将数据集划分为训练集和测试集 (test_set),然后将训练集再次划分为训练集(train_set) 和验证集(valid_set)。例如有10000个样本的数据集,第一次划分80%训练,20%测试,那么test_set有2000个样本,训练数据有8000个样本,第二次对这8000个样本再次划分,70%作训练集,30%作测试集,那么train_set有5600个样本,2400个样本为valid_set。
- 然后创建第一层的多模型,这些模型可以是同质的也可以是异质的。例如在这一层我们使用了k个SVM,或者使用了SVM、随机森林和XGBoost等。
- 使用train_set训练第一层的多模型,得到 m o d e l A = { m o d e l 1 , m o d e l 2 , … , m o d e l k } modelA=\{model_1,model_2,\dots,model_k\} modelA={ model1,model2,…,modelk},然后再用这k个模型预测valid_set和test_set,得到k组valid_predict和test_predict1 (每个模型预测出一组结果)。此时 v a l i d _ p r e d i c t = { v a l i d _ p r e d i c t 1 , v a l i d _ p r e d i c t 2 , … , v a l i d _ p r e d i c t k } t e s t _ p r e d i c t 1 = { t e s t _ p r e d i c t 1 , t e s t _ p r e d i c t 2 , … , t e s t _ p r e d i c t k } valid\_predict=\{valid\_predict_1,valid\_predict_2,\dots,valid\_predict_k\}\\ test\_predict1=\{test\_predict_1,test\_predict_2,\dots,test\_predict_k\} valid_predict={ valid_predict1,valid_predict2,…,valid_predictk}test_predict1={ test_predict1,test_predict2,…,test_predictk}
- 创建第二层的模型,用第一层预测得到的 v a l i d _ p r e d i c t = { v a l i d _ p r e d i c t 1 , v a l i d _ p r e d i c t 2 , … , v a l i d _ p r e d i c t k } valid\_predict=\{valid\_predict_1,valid\_predict_2,\dots,valid\_predict_k\} valid_predict={ valid_predict1,valid_predict2,…,valid_predictk}作为第二层模型的训练数据,训练得到第二层的模型modelB,然后预测第一层得到的 t e s t _ p r e d i c t 1 = { t e s t _ p r e d i c t 1 , t e s t _ p r e d i c t 2 , … , t e s t _ p r e d i c t k } test\_predict1=\{test\_predict_1,test\_predict_2,\dots,test\_predict_k\} test_predict1={ test_predict1,test_predict2,…,test_predictk},获得最终的预测结果test_predict。
- Blending算法的优点:
实现简单粗暴,没有太多的理论分析。 - Blending算法的缺点:
只使用了一部分数据作为留出集进行验证,也就是只能用到数据的一部分,这对于数据来说是奢侈的。
1.2 代码实例
# 加载相关工具包
import numpy as np
import pandas as pd
import matplotlib.pyplot as plt
plt.style.use("ggplot")
%matplotlib inline
import seaborn as sns
## 我们利用 sklearn 中自带的 iris 数据作为数据载入,并利用Pandas转化为DataFrame格式
from sklearn.datasets import load_iris
data = load_iris()
iris_target = data.target #得到数据对应的标签
iris_features = pd.DataFrame(data=data.data, columns=data.feature_names) #利用Pandas转化为DataFrame格式
# 划分数据集
from sklearn.model_selection import train_test_split
## 选择其类别为0和1的样本 (不包括类别为2的样本)(前50个为0类,中间50为1类)
iris_features_part = iris_features.iloc[:100]
iris_target_part = iris_target[:100]
## 测试集大小为20%, 80%/20%分
x_train1, x_test, y_train1, y_test = train_test_split(iris_features_part, iris_target_part, test_size = 0.2, random_state = 2020)
## 然后再对训练集进行划分,得到训练集和验证集
x_train, x_val, y_train, y_val = train_test_split(x_train1, y_train1, test_size = 0.3, random_state = 2020)
# 查看各数据集大小
print("The shape of training X:",x_train.shape)
print("The shape of training y:",y_train.shape)
print("The shape of test X:",x_test.shape)
print("The shape of test y:",y_test.shape)
print("The shape of validation X:",x_val.shape)
print("The shape of validation y:",y_val.shape)
The shape of training X: (56, 4)
The shape of training y: (56,)
The shape of test X: (20, 4)
The shape of test y: (20,)
The shape of validation X: (24, 4)
The shape of validation y: (24,)
#  设置第一层分类器
from sklearn.svm import SVC
from sklearn.ensemble import RandomForestClassifier
from sklearn.neighbors import KNeighborsClassifier

clfs = [SVC(probability = True),RandomForestClassifier(n_estimators=5, n_jobs=-1, criterion='gini'),KNeighborsClassifier()]

# 输出第一层的验证集结果与测试集结果
val_features = np.zeros((x_val.shape[0],len(clfs)))  # 初始化验证集结果
test_features = np.zeros((x_test.shape[0],len(clfs)))  # 初始化测试集结果

for i,clf in enumerate(clfs):
    clf.fit(x_train,y_train)
    val_feature = clf.predict_proba(x_val)[:, 1]
    test_feature = clf.predict_proba(x_test)[:,1]
    val_features[:,i] = val_feature
    test_features[:,i] = test_feature
# 设置第二层分类器
from sklearn.linear_model import LinearRegression
lr = LinearRegression()

# 将第一层的验证集的结果输入第二层训练第二层分类器
lr.fit(val_features,y_val)
LinearRegression()
# 输出预测的结果
from sklearn.model_selection import cross_val_score
cross_val_score(lr,test_features,y_test,cv=5)
array([1., 1., 1., 1., 1.])
可以看到集成效果非常好。
2 Stacking集成算法
针对Blending算法的缺点,只使用了验证集的数据作为第二层的训练数据,也就是只用到了一部分数据,造成了数据浪费。究其原因是因为在划分验证集时我们使用分割法只划分了30%的数据。为了利用全部数据且对数据分割,我们想到了交叉验证,既分割数据又能利用全部数据。
2.1 算法流程
Blending集成学习的算法流程:
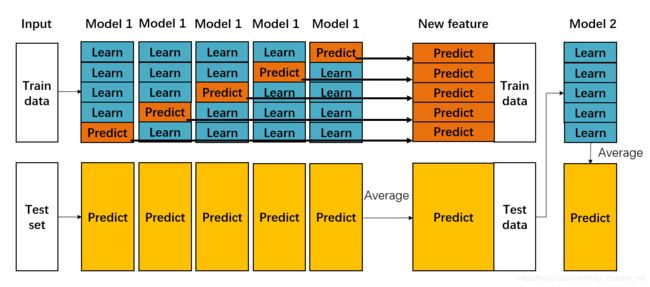
- 将数据集划分为训练集和测试集 (test_set),对于划分的训练集进行K折交叉验证。例如有10000个样本的数据集,第一次划分80%训练,20%测试,那么test_set有2000个样本,训练数据有8000个样本。第二次对这8000个样本再次划分,进行5折交叉验证,那么会有5组训练样本为6400验证样本为1600的train_set和valid_set。
- 每次交叉验证相当于用蓝色的6400条数据训练出一个模型,使用模型对橙色的1600条数据进行验证,并对测试集进行预测,得到2000条预测结果。这样经过5次交叉检验,可以得到中间的橙色的5* 1600条验证集的结果(相当于每条数据的预测结果),5* 2000条测试集的预测结果。
- 接下来会将验证集的5* 1600条预测结果拼接成8000行长的矩阵,标记为 1 ,而对于5* 2000行的测试集的预测结果进行加权平均,得到一个2000行一列的矩阵,标记为 1 。
- 上面得到一个基模型在数据集上的预测结果 1 、 1 ,这样当我们对3个基模型进行集成的话,相于得到了 1 、 2 、 3 、 1 、 2 、 3 六个矩阵。
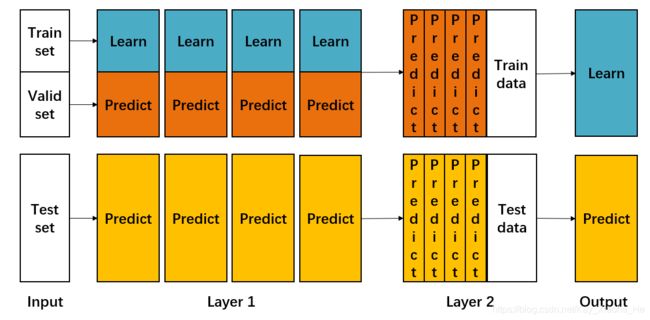
- 之后我们会将 1 、 2 、 3 并列在一起成8000行3列的矩阵作为training data, 1 、 2 、 3 合并在一起成2000行3列的矩阵作为testing data,让下层学习器基于这样的数据进行再训练。
- 再训练是基于每个基础模型的预测结果作为特征(三个特征),次学习器会学习训练如何往这样的基学习的预测结果上赋予权重w,来使得最后的预测最为准确。

第1、2步的示意图如上,第3、4、5、6步的示意图如下。

Blending与Stacking对比:
- Blending的优点在于:
比stacking简单(因为不用进行k次的交叉验证来获得stacker feature) - 而缺点在于:
使用了很少的数据(是划分hold-out作为测试集,并非cv)
blender可能会过拟合(其实大概率是第一点导致的)
stacking使用多次的CV会比较稳健
2.2 代码实例
## 导入所需库
from sklearn.model_selection import cross_val_score
from sklearn.linear_model import LogisticRegression
from sklearn.neighbors import KNeighborsClassifier
from sklearn.naive_bayes import GaussianNB
from sklearn.ensemble import RandomForestClassifier
from mlxtend.classifier import StackingCVClassifier
from matplotlib import pyplot as plt
## 导入鸢尾花数据集
from sklearn import datasets

iris = datasets.load_iris()
X, y = iris.data[:, 1:3], iris.target
## 构建基模型,分别为KNN、RF、贝叶斯分类器,第二层模型为LR
RANDOM_SEED = 42

clf1 = KNeighborsClassifier(n_neighbors=1)
clf2 = RandomForestClassifier(random_state=RANDOM_SEED)
clf3 = GaussianNB()
lr = LogisticRegression()

# Starting from v0.18.0, StackingCVRegressor supports
# `random_state` to get deterministic result.
sclf = StackingCVClassifier(classifiers=[clf1, clf2, clf3],  # 第一层分类器
                            meta_classifier=lr,   # 第二层分类器
                            random_state=RANDOM_SEED)
## 进行5折交叉验证
print('5-fold cross validation:\n')

for clf, label in zip([clf1, clf2, clf3, sclf], ['KNN', 'Random Forest', 'Naive Bayes','StackingClassifier']):
    scores = cross_val_score(clf, X, y, cv=5, scoring='accuracy')
    print("Accuracy: %0.2f (+/- %0.2f) [%s]" % (scores.mean(), scores.std(), label))
5-fold cross validation:
Accuracy: 0.91 (+/- 0.07) [KNN]
Accuracy: 0.94 (+/- 0.04) [Random Forest]
Accuracy: 0.91 (+/- 0.04) [Naive Bayes]
Accuracy: 0.94 (+/- 0.04) [StackingClassifier]
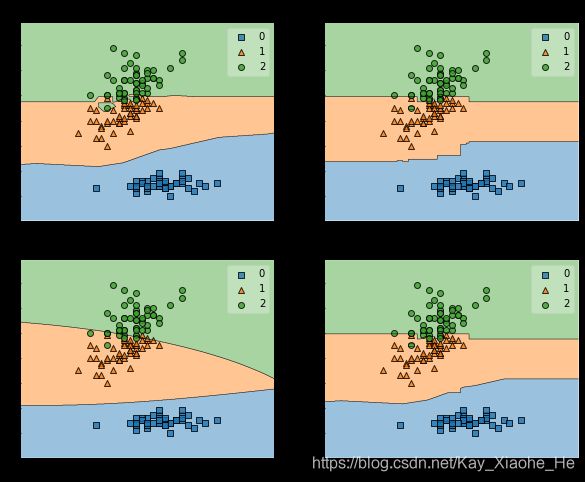
# 我们画出决策边界
from mlxtend.plotting import plot_decision_regions
import matplotlib.gridspec as gridspec
import itertools

gs = gridspec.GridSpec(2, 2)
fig = plt.figure(figsize=(10,8))
for clf, lab, grd in zip([clf1, clf2, clf3, sclf],
                         ['KNN',
                          'Random Forest',
                          'Naive Bayes',
                          'StackingCVClassifier'],
                          itertools.product([0, 1], repeat=2)):
    clf.fit(X, y)
    ax = plt.subplot(gs[grd[0], grd[1]])
    fig = plot_decision_regions(X=X, y=y, clf=clf)
    plt.title(lab)
plt.show()

