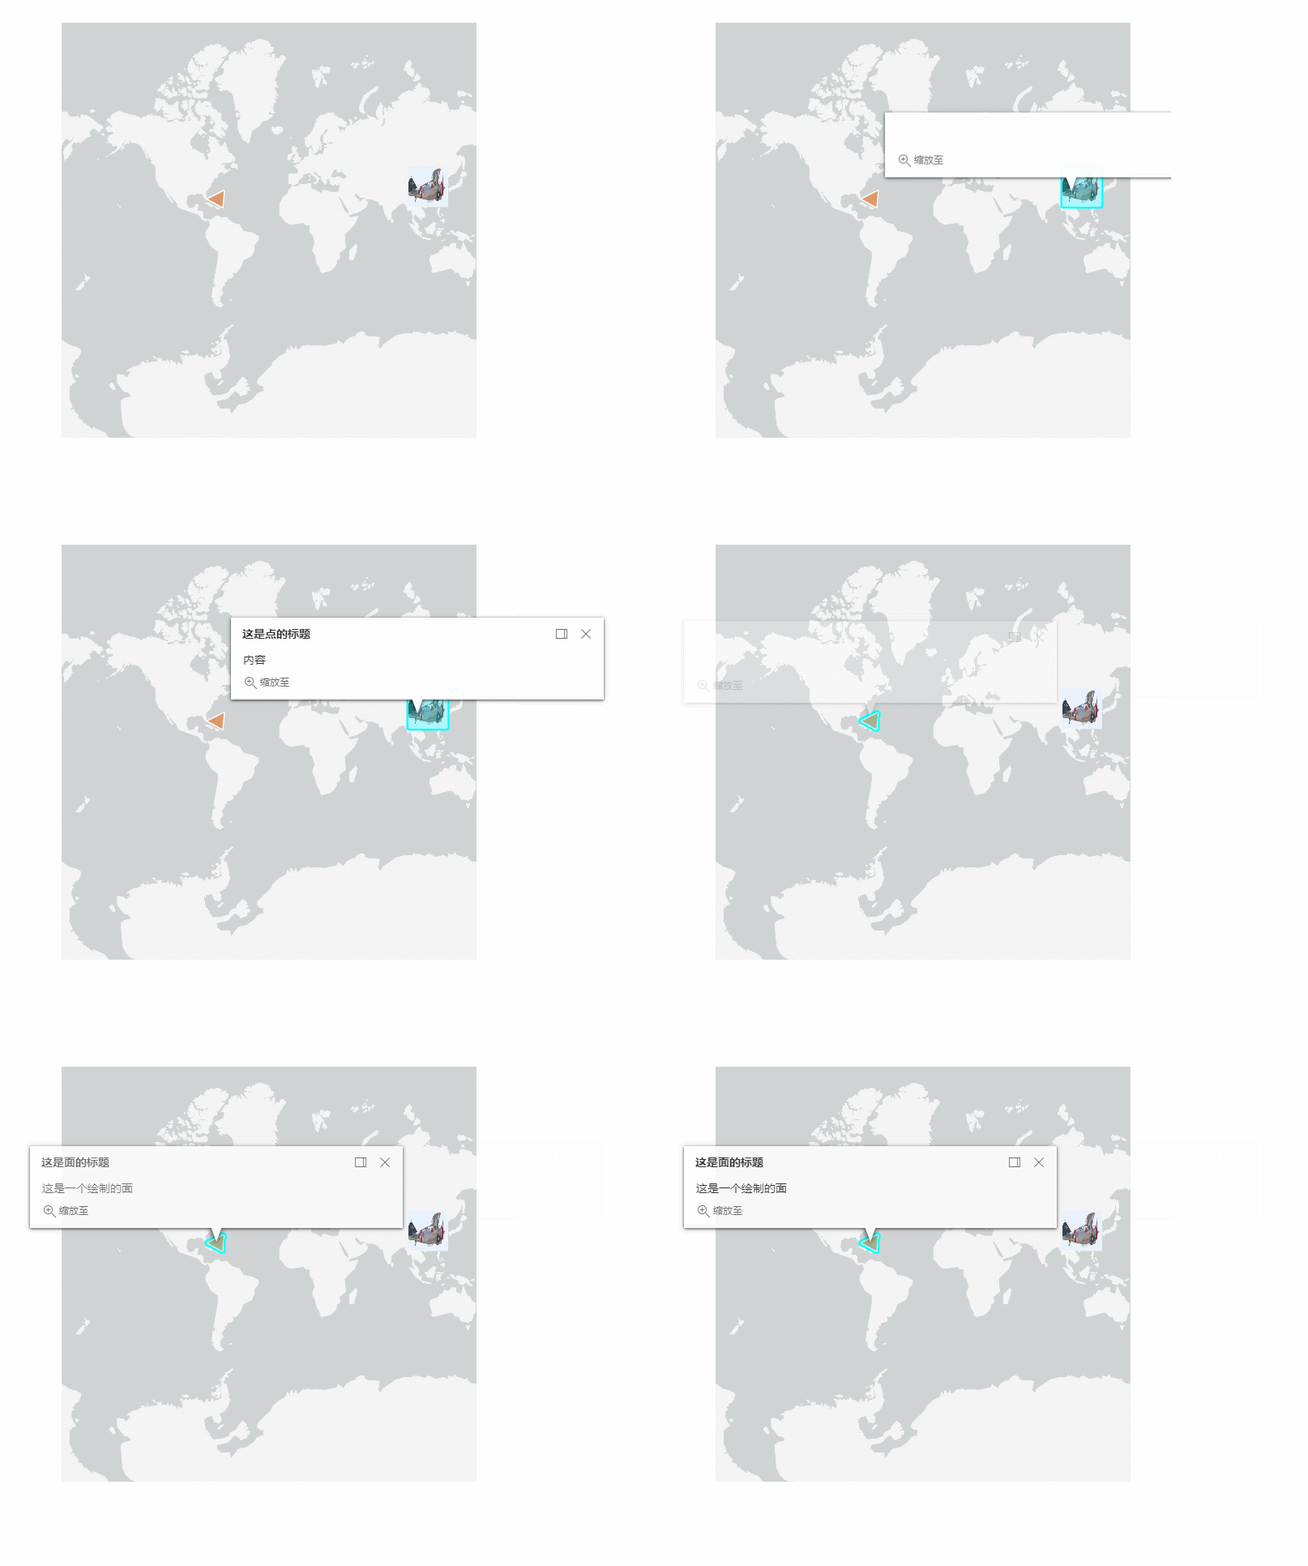
arcgis api for js4.x实现点击图层上的绘制的Graphics点,弹出点信息。
arcgis api for js4.x
在Map地图中添加GraphicsLayer图层,在GraphicsLayer图层添加绘制graphics点,点击绘制的点,弹出信息框。
hitTest(screenPoint, options)
单击视图的屏幕坐标(或本机鼠标事件)。
用于指定hitTest中包含或排除的内容的选项。
返回与指定屏幕坐标相交的每个图层的最上面的要素。图层类型返回结果:GraphicsLayer、FeatureLayer、CSVLayer、GeoRSSLayer、KMLLayer和StreamLayer。
详情:https://developers.arcgis.com/javascript/latest/api-reference/esri-views-MapView.html#hitTest
为Graphic添加属性
var attributes = {
    Name: "I am a point",
    Park: "Griffith Park",
    City: "Los Angeles"
  };
  // Create popup template
  var popupTemplate = {
    title: "{Name}",
    content: "I live in {Park} in the city of {City}."
  };
 var pointGraphic = new Graphic({
    geometry: point,
    symbol: markerSymbol,
    attributes: attributes,
    popupTemplate: popupTemplate
  });
  view.graphics.add(pointGraphic);
问题:
动态加几个点到地图上,并用图片渲染,点击弹窗
方法:
Graphicslayer 上的graphic有popupTemplate属性点击graphic可以弹窗.
完整代码:
<!DOCTYPE html>
<html lang="en">

<head>
    <meta charset="UTF-8">
    <meta name="viewport" content="width=device-width, initial-scale=1.0">
    <meta http-equiv="X-UA-Compatible" content="ie=edge">
    <title>Document</title>
    <link rel="stylesheet" href="https://js.arcgis.com/4.16/esri/themes/light/main.css" />
    <script src="https://js.arcgis.com/4.16/"></script>
    <style>
        html,
        body,
        #viewDiv {

            padding: 0;
            margin: 0;
            height: 100%;
            width: 100%;
        }
    </style>
    <script>
        require([
            "esri/Map",
            "esri/views/MapView",
            "esri/Basemap",
            "esri/core/urlUtils",
            "esri/geometry/Extent",
            "esri/geometry/Point",
            "esri/layers/GraphicsLayer",
            "esri/layers/MapImageLayer",
            "esri/views/MapView",
            "esri/Graphic",
            "esri/Color",
            "esri/symbols/PictureFillSymbol",
            "esri/geometry/SpatialReference",
            "dojo/_base/connect",
            "dojo/dom",
            "dojo/on",
            "dojo/domReady!"
        ], function(
            Map,
            MapView,
            Basemap,
            urlUtils,
            Extent,
            Point,
            GraphicsLayer,
            MapImageLayer,
            MapView,
            Graphic,
            Color,
            PictureFillSymbol,
            SpatialReference,
            connect,
            dom,
            on) {

            //初始化范围
            var startExtent = new Extent({

                min_x: 417870,
                min_y: 2803345,
                max_x: 459320,
                max_y: 2866449,
                spatialReference: 4549
            });
            var map = new Map({

                basemap: "gray-vector"
            });
            //视图
            var view = new MapView({

                container: "viewDiv",
                map: map
            });
            //创建一个图层
            var graphicsLayer = new GraphicsLayer();
            //设置可见
            graphicsLayer.visible = true;
            //创建一个面
            var point = {

                type: "point",
                x: 111.453449,
                y: 34.624092,
                SpatialReference: 4326
            };
            var symbol = {

                type: "picture-marker",
                url: "https://ss1.bdstatic.com/70cFvXSh_Q1YnxGkpoWK1HF6hhy/it/u=1337419192,366595857&fm=26&gp=0.jpg",
                width: "50px",
                height: "50px",
                outline: {

                    style: "solid"
                },
            };
            var popupTemplate1 = {

                title: "这是点的标题",
                content: "内容"
            };
            var graphic = new Graphic({

                geometry: point,
                symbol: symbol,
                popupTemplate: popupTemplate1
            });
            //创建一个面
            var polygon = {

                type: "polygon",
                rings: [
                    [-64.78, 32.3],
                    [-66.07, 18.45],
                    [-80.21, 25.78],
                    [-64.78, 32.3]
                ]
            };
            var fillSymbol = {

                type: "simple-fill",
                color: [227, 139, 79, 0.8],
                outline: {

                    color: [255, 255, 255],
                    width: 1
                }
            };
            var popupTemplate2= {

                title: "这是面的标题",
                content: "这是一个绘制的面"
            };
            var polygonGraphic = new Graphic({

                geometry: polygon,
                symbol: fillSymbol,
                popupTemplate: popupTemplate2
            });
            //添加多个要素
            graphicsLayer.graphics.addMany([graphic, polygonGraphic]);
            //添加单个要素
            //graphicsLayer.graphics.add(graphic);
            //添加单个图层
            map.add(graphicsLayer);
            //添加多个图层
            //map.addMany([layer, layer2]);
            view.on("click", function(event) {

                view.hitTest(event).then(function(response) {

                    if (response.results.length) {

                        var graphic = response.results.filter(function(result) {

                            // check if the graphic belongs to the layer of interest
                            return result.graphic.layer === graphicsLayer;
                        })[0].graphic;
                        console.log(graphic.geometry);
                    }
                });
            });
        });
    </script>
</head>

<body>
    <div id="viewDiv"></div>
</body>

</html>

  实现效果图:

  Tips:
 问题:
 [esri.core.Accessor] Accessor#set Invalid property value, value needs to be one of ‘esri.geometry.Extent’, ‘esri.geometry.Multipoint’, ‘esri.geometry.Point’, ‘esri.geometry.Polyline’, ‘esri.geometry.Polygon’, or a plain object that can autocast (having .type = ‘extent’, ‘multipoint’, ‘point’, ‘polyline’, ‘polygon’)

 var point = {
 type: “point”,
 x: 116.026,
 y: 28.6826,
 };
 point写为Point,此处应为小写。
