matplotlib之pyplot模块——绘制对数线图(loglog()、semilogx()、semilogy())
当前有效matplotlib版本为:3.4.1。
对数图
常规图表坐标轴采用算术尺度(线形尺度)。对数图即坐标轴采用对数尺度的图表。
对数图分为双对数图和半对数图,双对数图是两个坐标轴都采用对数尺度,半对数图就是一个坐标轴采用对数尺度。
matplotlib中pyplot模块的loglog()用于绘制双对数图,semilogx()、semilogy()用于绘制半对数图。这三个函数的应用非常相似,都是对plot函数的封装,plot函数的相关概念和参数这三个函数都可以应用。这三个函数的区别在于:
loglog()对于两个坐标轴都应用对数尺度。
semilogx()、semilogy()分别对x和y轴应用对数尺度。
这三个函数的签名如下:
matplotlib.pyplot.loglog(*args, **kwargs)
matplotlib.pyplot.semilogx(*args, **kwargs)
matplotlib.pyplot.semilogy(*args, **kwargs)
与plot函数相比,这三个参数额外多了3个参数,用于传递给 Axes.set_xscale和 Axes.set_yscale。
base:对数的底。浮点数,默认值为10。subs:次级刻度的位置。序列,可选参数。nonpositive:非正数值将会被屏蔽或者被修剪为非常小的正数。取值范围为{'mask', 'clip'},默认值为'mask'。**kwargs:plot函数支持的所有参数。
返回值为Line2D对象列表。
源码分析
根据源码可以,这三个函数其实是结合了plot、xscale、yscale函数的功能,相当于一个快捷接口。
因此,这三个函数的应用等效于直接使用plot、xscale、yscale函数。
axes.loglog方法源码:
def loglog(self, *args, **kwargs):
    dx = {
     k: v for k, v in kwargs.items()
          if k in ['base', 'subs', 'nonpositive',
                   'basex', 'subsx', 'nonposx']}
    self.set_xscale('log', **dx)
    dy = {
     k: v for k, v in kwargs.items()
          if k in ['base', 'subs', 'nonpositive',
                   'basey', 'subsy', 'nonposy']}
    self.set_yscale('log', **dy)
    return self.plot(
        *args, **{
     k: v for k, v in kwargs.items() if k not in {
     *dx, *dy}})
案例
import numpy as np
import matplotlib.pyplot as plt


t = np.arange(0.01, 20.0, 0.01)

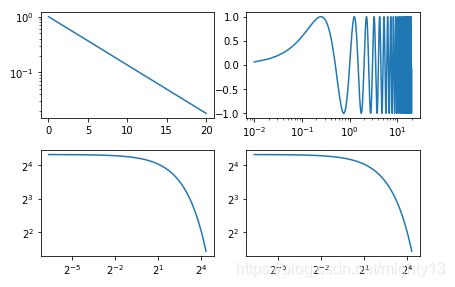
fig, ((ax1, ax2), (ax3, ax4)) = plt.subplots(2, 2)

ax1.semilogy(t, np.exp(-t / 5.0))

ax2.semilogx(t, np.sin(2 * np.pi * t))

ax3.loglog(t, 20 * np.exp(-t / 10.0), base = 2)


ax4.set_xscale("log", base = 2)
ax4.set_yscale("log", base = 2)
ax4.plot(t, 20 * np.exp(-t / 10.0))


fig.tight_layout()
plt.show()
