可视化实验十一:利用Python绘制气泡图、雷达图
实验目的:
- 掌握Python中气泡图、雷达图绘图函数的使用及展示图形的意义
- 利用上述绘图函数实现数据可视化
实验内容:
- 练习python中气泡图、雷达图绘图函数的用法,掌握相关参数的概念
- 根据步骤一绘图函数要求,处理实验数据
- 根据步骤二得到的实验数据,绘制气泡图、雷达图
- 练习如何通过调整参数使图片呈现不同效果,例如颜色、图例位置、背景网格、坐标轴刻度和标记等
实验过程(附结果截图):
1. 练习python中气泡图、雷达图绘图函数的用法,掌握相关参数的概念
(1)绘制气泡图
import matplotlib.pyplot as plt
import numpy as np

# 这两行代码解决 plt 中文显示的问题
plt.rcParams['font.sans-serif'] = ['SimHei']
plt.rcParams['axes.unicode_minus'] = False

# 输入产量与温度数据
production = [1125, 1725, 2250, 2875, 2900, 3750, 4125]
tem = [6, 8, 10, 13, 14, 16, 21]
rain = [25, 40, 58, 68, 110, 98, 120]

colors = np.random.rand(len(tem))  # 颜色数组
size = production
plt.scatter(tem, rain, s=size, c=colors, alpha=0.6)  # 画散点图, alpha=0.6 表示不透明度为 0.6
plt.ylim([0, 150])  # 纵坐标轴范围
plt.xlim([0, 30])   # 横坐标轴范围
plt.xlabel('温度')  # 横坐标轴标题
plt.ylabel('降雨量')  # 纵坐标轴标题
plt.show()
import numpy as np
import matplotlib.pyplot as plt
# 用于正常显示中文
plt.rcParams['font.sans-serif'] = 'SimHei'
#用于正常显示符号
plt.rcParams['axes.unicode_minus'] = False

# 使用ggplot的绘图风格,这个类似于美化了,可以通过plt.style.available查看可选值,你会发现其它的风格真的丑。。。
plt.style.use('ggplot')

# 构造数据
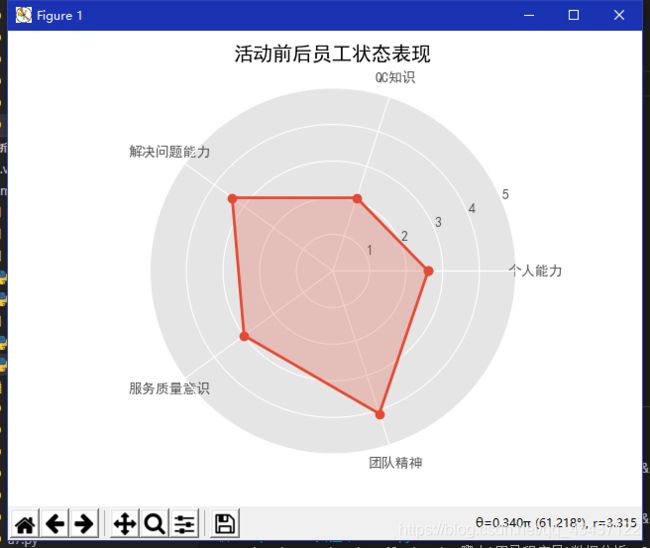
values = [2.6,2.1,3.4,3,4.1]
feature = ['个人能力','QC知识','解决问题能力','服务质量意识','团队精神']

# 设置每个数据点的显示位置,在雷达图上用角度表示
angles=np.linspace(0, 2*np.pi,len(values), endpoint=False)

# 拼接数据首尾,使图形中线条封闭
values=np.concatenate((values,[values[0]]))
angles=np.concatenate((angles,[angles[0]]))

# 绘图
fig=plt.figure()
# 设置为极坐标格式
ax = fig.add_subplot(111, polar=True)
# 绘制折线图
ax.plot(angles, values, 'o-', linewidth=2)
# 填充颜色
ax.fill(angles, values, alpha=0.25)

# 设置图标上的角度划分刻度,为每个数据点处添加标签
ax.set_thetagrids(angles * 180/np.pi, feature)

# 设置雷达图的范围
ax.set_ylim(0,5)
# 添加标题
plt.title('活动前后员工状态表现')
# 添加网格线
ax.grid(True)

plt.show()
(1)实验数据
d = {
     "时间":pd.Series([2006,2007,2008,2009,2010]),
  "数量":pd.Series([10,200,120,150,300]),
  "大小":pd.Series([50,130,40,50,160]),
  "分类":pd.Series([1,2,0,1,2]),
  "判断":pd.Series([True,True,True,True,True])}
3. 根据步骤二得到的实验数据,绘制气泡图、雷达图
(1)绘制气泡图
import pandas as pd
import matplotlib.pyplot as plt
import pandas as pd

d = {
     "时间": pd.Series([2006, 2007, 2008, 2009, 2010]),
     "数量": pd.Series([10, 200, 120, 150, 300]),
     "大小": pd.Series([50, 130, 40, 50, 160]),
     "分类": pd.Series([1, 2, 0, 1, 2]),
     "判断": pd.Series([True, True, True, True, True])}

df = pd.DataFrame(d)

# 先定义气泡大小,rank 函数将大小列进行大小分配,越大的值分配结果也越高
# n 为倍数,用来调节气泡的大小,且看后头

size = df['大小'].rank()
n = 20

# 定义一个字典,将颜色跟对应的分类进行绑定

color = {
     0: 'red', 1: 'blue', 2: 'orange'}

# 增加color的参数,用列表解析式将data分类中的每个数据的数字映射到前面color的颜色中

plt.scatter(df['数量'], df['大小'], color=[color[i]
            for i in df['分类']])
plt.show()
import numpy as np
import matplotlib.pyplot as plt

# 标签
labels = np.array(['语文', '数学', '英语', '生物', '物理', '化学'])
# 数据个数
dataLenth = 6
# 数据
data = np.array([7, 4, 3, 6, 4, 8])

angles = np.linspace(0, 2*np.pi, dataLenth, endpoint=False)
data = np.concatenate((data, [data[0]]))  # 闭合
angles = np.concatenate((angles, [angles[0]]))  # 闭合

fig = plt.figure()
ax = fig.add_subplot(111, polar=True)  # polar参数!!
ax.plot(angles, data, 'bo-', linewidth=2)  # 画线
ax.fill(angles, data, facecolor='r', alpha=0.25)  # 填充
ax.set_thetagrids(angles * 180/np.pi, labels, fontproperties="SimHei")
ax.set_title("matplotlib雷达图", va='bottom', fontproperties="SimHei")
ax.set_rlim(0, 10)
ax.grid(True)
plt.show()

4. 练习如何通过调整参数使图片呈现不同效果,例如颜色、图例位置、背景网格、坐标轴刻度和标记等
(1)绘制气泡图
import pandas as pd
import matplotlib.pyplot as plt
import pandas as pd

d = {
     "时间": pd.Series([2006, 2007, 2008, 2009, 2010]),
     "数量": pd.Series([10, 200, 120, 150, 300]),
     "大小": pd.Series([50, 130, 40, 50, 160]),
     "分类": pd.Series([1, 2, 0, 1, 2]),
     "判断": pd.Series([True, True, True, True, True])}

df = pd.DataFrame(d)

# 先定义气泡大小,rank 函数将大小列进行大小分配,越大的值分配结果也越高
# n 为倍数,用来调节气泡的大小,且看后头

size = df['大小'].rank()
n = 20

# 定义一个字典,将颜色跟对应的分类进行绑定

color = {
     0: 'red', 1: 'blue', 2: 'orange'}

# 增加color的参数,用列表解析式将data分类中的每个数据的数字映射到前面color的颜色中

plt.scatter(df['数量'], df['大小'], color=[color[i]
            for i in df['分类']], s=size*n, alpha=0.6)
plt.show()
import numpy as np
import matplotlib.pyplot as plt

# 标签
labels = np.array(['语文', '数学', '英语', '生物', '物理', '化学'])
# 数据个数
dataLenth = 6
# 数据
data = np.array([7, 4, 3, 6, 4, 8])

angles = np.linspace(0, 2*np.pi, dataLenth, endpoint=False)
data = np.concatenate((data, [data[0]]))  # 闭合
angles = np.concatenate((angles, [angles[0]]))  # 闭合

fig = plt.figure()
ax = fig.add_subplot(111, polar=True)  # polar参数!!
ax.plot(angles, data, 'bo-', linewidth=2)  # 画线
ax.fill(angles, data, facecolor='r', alpha=0.25)  # 填充
ax.set_thetagrids(angles * 180/np.pi, labels, fontproperties="SimHei")
ax.set_title("matplotlib雷达图", va='bottom', fontproperties="SimHei")
ax.set_rlim(0, 10)
ax.grid(True)
plt.show()


