导语:
这是一款可以制作各种类型的图表库,折线图,柱状图,圆状图,饼状图,同时伴有动画效果,代码简洁易懂。
1.安装
推荐使用cocoapods, 即 pod "PNChart",导入头文件 #import "PNChart.h"
当然你也可以手动导入,需要添加系统依赖库:
Foundation.framework
UIKit.framework
CoreGraphics.framework
QuartzCore.framework
2.使用
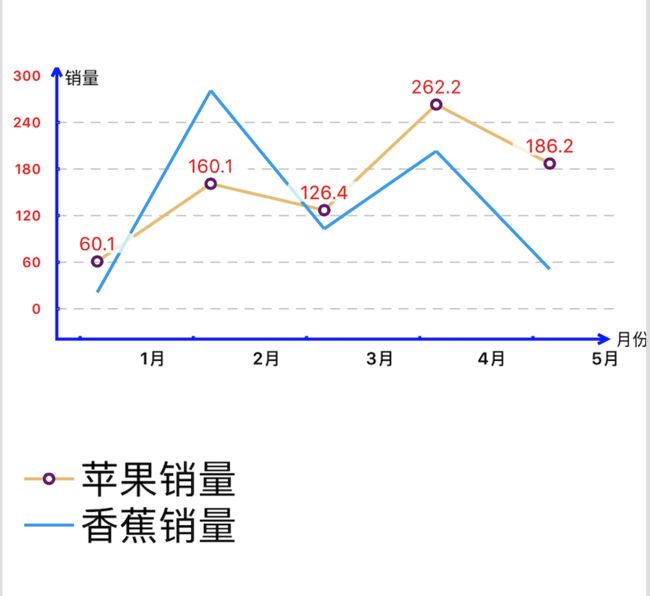
1.折线图
使用的类为PNLineChart,属性比较多,以下几种类型的图,属性就不一一介绍了,可以参考着折线图
- (void)makeLineChart{
    PNLineChart *lineChart = [[PNLineChartalloc] initWithFrame:CGRectMake(0, 100, SCREEN_WIDTH, 200)];

    lineChart.yFixedValueMax =300;
    lineChart.yFixedValueMin =0;
    // lineChart.yLabelNum = 2;//设置Y轴有几个等级数值,默认自动计算
    //是否显示X轴数值
    lineChart.showLabel = YES;
    //是否显示Y轴的数值
    lineChart.showGenYLabels = YES;
    //是否显示横向曲线, Y轴网络线
    lineChart.showYGridLines = YES;
    //是否显示平滑的曲线
    lineChart.showSmoothLines = NO;
    //是否显示 xy 坐标轴
    lineChart.showCoordinateAxis = YES;
    //动画
    lineChart.displayAnimated =YES;
    //轴的颜色
    lineChart.axisColor = [UIColor blueColor];
    //轴的宽度
    lineChart.axisWidth =2.0f;
    //纵坐标上是否显示小数
    lineChart.thousandsSeparator =YES;
    //设置Y轴坐标值的颜色
    lineChart.yLabelColor = [UIColor redColor];
    //x轴单位
    lineChart.xUnit =@"月份";
    lineChart.yUnit =@"销量";
    //设置X轴上的坐标内容
    [lineChart setXLabels:@[@"1月",@"2月",@"3月",@"4月",@"5月"]];
    //line Chart No 1
    NSArray *dataAry1 =@[@"60.1", @"160.1", @"126.4",@"262.2", @"186.2"];
    PNLineChartData *data1 = [PNLineChartDatanew];
    data1.color = PNYellow;
    // data1.dataTitle = @"Helloworld";
    //设置点的样式
    data1.inflexionPointStyle = PNLineChartPointStyleCircle;
    data1.inflexionPointColor = [UIColorpurpleColor];
    //坐标值是否显示
    data1.showPointLabel =YES;
    //坐标值显示的颜色
    data1.pointLabelColor = [UIColor redColor];
    //坐标值的字体大小
    data1.pointLabelFont = [UIFontsystemFontOfSize:12];
    //坐标值显示几位数
    data1.pointLabelFormat =@"%1.1f";
    //设置折线有几个值
    data1.itemCount = lineChart.xLabels.count;
    data1.getData = ^PNLineChartDataItem*(NSUInteger item) {
        CGFloat yValue = [dataAry1[item] floatValue];
        //设置X轴对应的Y轴的值
        return[PNLineChartDataItem dataItemWithY:yValue];
    };

    //Line Chart No 2
    NSArray *dataAry2 =@[@"20.1", @"280.1", @"102.4",@"202.2", @"49.3"];
    PNLineChartData *data2 = [PNLineChartDatanew];
   data2.color = PNTwitterColor;
   data2.itemCount = lineChart.xLabels.count;
   data2.getData = ^PNLineChartDataItem*(NSUInteger item) {
        CGFloat yValue = [dataAry2[item]floatValue];
        return[PNLineChartDataItem dataItemWithY:yValue];
    };
    // lineChart.delegate = self;
    //注意:此句要在添加图例之前写
    lineChart.chartData =@[data1, data2];
    [self.view addSubview: lineChart];

    //添加图例
    data1.dataTitle =@"苹果销量";
    data2.dataTitle =@"香蕉销量";
    //横向显示
    lineChart.legendStyle =PNLegendItemStyleStacked;
    lineChart.legendFontColor = [UIColorblackColor];
    lineChart.legendFont = [UIFontsystemFontOfSize:25.0];
    //图例所在位置
    UIView *legend = [lineChartgetLegendWithMaxWidth:200];
    // legend.backgroundColor =[UIColor redColor];
    [legend setFrame:CGRectMake(10, 350,
legend.frame.size.width, legend.frame.size.height)];
    //显示比例
    lineChart.hasLegend =YES;
    //显示位置
    lineChart.legendPosition =PNLegendPositionBottom;
    //绘制出来
    [lineChart strokeChart];
    [self.view addSubview: legend];
}
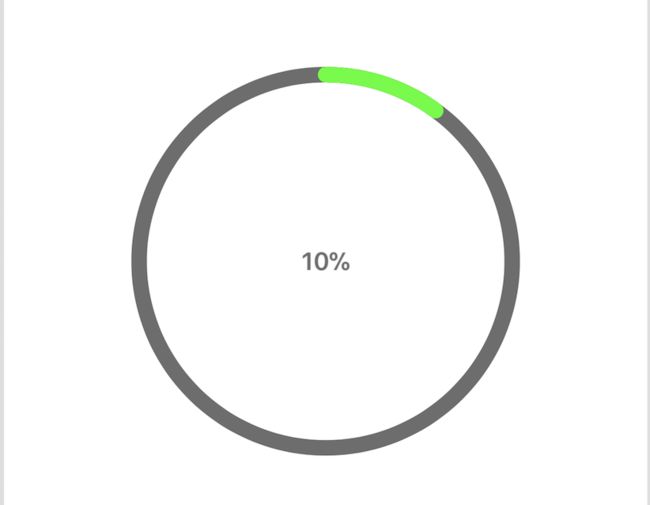
2.圆状图
- (void)makeCircleChart
{
    /*参数:
     clocwise:逆时针还是顺时针
     shadow:剩下的百分数现显示的颜色
     overrideLineWidth:宽度
     */
    PNCircleChart *circleChart =[[PNCircleChart alloc] initWithFrame:CGRectMake(0,100, SCREEN_WIDTH, 250)
total:@100
current:@10
clockwise:YES
shadow:YESshadowColor:[UIColor grayColor]
displayCountingLabel:YES
overrideLineWidth:@10];

    circleChart.chartType =PNChartFormatTypePercent;
    circleChart.strokeColor = [UIColorgreenColor];
    circleChart.duration =3;//进度条持续时间
    [circleChart strokeChart];
    [self.view addSubview: circleChart];
}
3.柱状图
- (void)makeBarChart{
    PNBarChart *barChart = [[PNBarChart alloc]initWithFrame:CGRectMake(0, 100, SCREEN_WIDTH, 250)];

    //是否显示xy轴的数字
    barChart.showLabel =YES;
    //是否显示水平线,把柱子压低上移了
    // barChart.showLevelLine = YES;
    //是否显示xy轴
    barChart.showChartBorder =YES;
    //是否显示柱子上的数值
    barChart.isShowNumbers =YES;
    //立体显示
    barChart.isGradientShow =YES;
    //设置柱子的圆角
    barChart.barRadius =5;
    barChart.labelTextColor = [UIColorblueColor];
    // barChart.xLabelWidth = 10.f;
    barChart.yChartLabelWidth =10;
    barChart.chartMarginLeft =10;
    barChart.chartMarginRight =10;
    barChart.chartMarginTop =5;
    barChart.chartMarginBottom =10;
    barChart.labelMarginTop =5.0;//X坐标刻度的上边距
    //设置bar Color
    barChart.strokeColor = [UIColor redColor];
    barChart.xLabels =@[@"1", @"2",@"3", @"4",@"5"];
    barChart.yValues =@[@"20", @"36",@"78", @"60",@"92"];
    barChart.yLabelFormatter = ^NSString*(CGFloat yLabelValue) {
        return[NSString stringWithFormat:@"%f", yLabelValue];
    };

    //开始绘制
    [barChart strokeChart];
    [self.view addSubview:barChart];
}
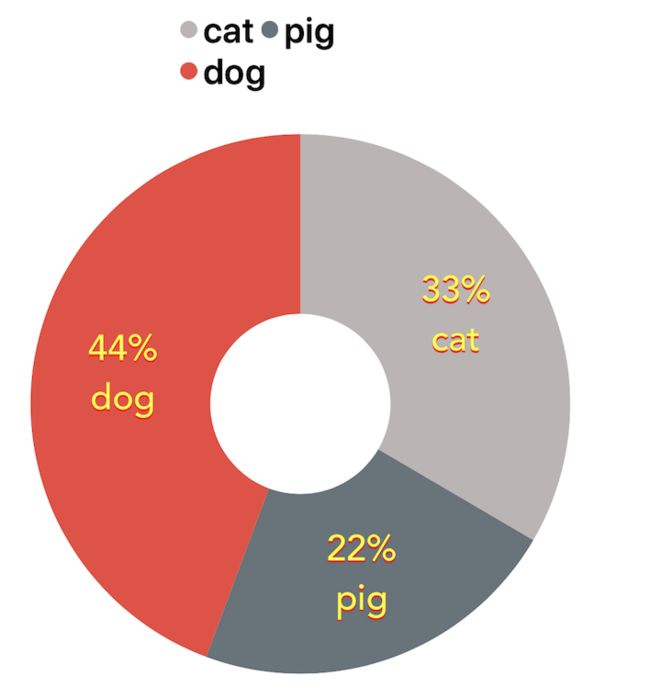
4.饼状图
- (void)makePieChart{
    NSArray*items = @[
                       [PNPieChartDataItem dataItemWithValue:30 color:PNPinkGrey description:@"cat"],
                       [PNPieChartDataItem dataItemWithValue:20 color:PNDarkBlue description:@"pig"],
                       [PNPieChartDataItem dataItemWithValue:40 color:PNRed description:@"dog"]];
    PNPieChart*pieChart = [[PNPieChart alloc] initWithFrame:CGRectMake(20, 100, 300, 300) items:items];
    // pieChart.delegate = self;
    pieChart.descriptionTextColor= [UIColor yellowColor];
    pieChart.descriptionTextFont= [UIFont fontWithName:@"Avenir-Medium" size:20];
    //阴影颜色
    pieChart.descriptionTextShadowColor= [UIColor redColor];
    //显示实际数值,不显示实际比例
    pieChart.showAbsoluteValues= NO;
    //只显示数值,不显示内容描述
    pieChart.showOnlyValues= NO;
    pieChart.innerCircleRadius= 0;
    pieChart.outerCircleRadius= 0;
    [pieChartstrokeChart];
    //加到父视图上
    [self.view addSubview:pieChart];
    //显示比例
    pieChart.hasLegend= YES;
    //横向显示
    pieChart.legendStyle= PNLegendItemStyleSerial;
    pieChart.legendFont= [UIFont boldSystemFontOfSize:20];
    //显示位置
    pieChart.legendPosition= PNLegendPositionTop;
    //获得图例,当横向排布不下另起一行
    UIView*legend = [pieChart getLegendWithMaxWidth:100];
    legend.frame= CGRectMake(100,30, legend.bounds.size.width, legend.bounds.size.height);

    [self.view addSubview:legend];
}
3.效果图
CC394FA565CB13ABDDA3DA674A8EE45E.png
79AAE09C37ABD9AEEB7AD300C8E2B13E.png

0F7452E7833F3631D40A61F1540A8366.png
2832AF3AC01A1BBEDB4154B6248D8C9A.png