自然界的流系统,具有美丽的结构,例如下图展示了密西西比河的河流结构,出处在这里。
Rinaldo等人在1992年提出了Optimal Channel Network的概念,认为大自然的河流网络在最小化能量。反过来,如果我们从一个规则网格出发,不断最小化能量,也能得到一个类似河流的网络。关于OCN早期的文献综述见这里,最近也仍然有关于OCN模型的研究,例如这篇和这篇PNAS。
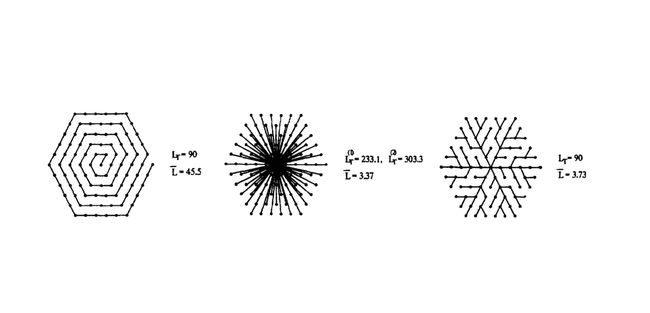
下图引用自这篇文章,展示了河流网络能量最小化的思路。
作者认为,河流网络要同时最小化全局和局部输运成本。螺旋结构最小化了全局成本(总链边长度),但每个节点到中心位置的平均输运成本非常高。反过来,星状网络里节点到中心位置的局部输运成本都很低,但总成本很高。树状网络则同时将两个成本都降到了最低。
在OCN模型中,Rinaldo等人找到了一个能量指标,系统在最小化这个能量的过程中会不断改变输运结构。该指标被定义为
![Eq. 1][1]
[1]: http://latex.codecogs.com/svg.latex?E=\Sigma_{i}A_i^\gamma,(0<\gamma<1)
其中
![Eq. 2][2]
[2]: http://latex.codecogs.com/svg.latex?A_i=1+\Sigma_jA_j
被定义为一棵树上直接或间接从属于节点i的所有节点的数量。因此,这是一个递归的结构,每一个根节点的A都等于其子节点的A之和。在实际河流系统中,这个变量对应的是一个汇的河流盆地面积。
OCN算法从一个二维网格开始,从中得到一个生成树(spanning tree),对这个生成树不断调整连边,并使用贪心(Greedy)算法接受那些能降低系统总能量的连边调整。所谓贪心,就是希望同时最大化当前利益(降低当前系统能量)和长远利益(最终找到全局最优解)。虽然这往往是不切实际的,但这种方法可以帮我们在短时间内尽快接受搜索,找到一个可以接受的方案。贪心算法的路径依赖较为严重,这里仅作展示。更好的方案是使用模拟退火,如这篇所介绍的。
我们先定义一系列函数如下
# preprare grid
def grid(L):
    G=nx.grid_2d_graph(L, L, periodic=False, create_using=None)
    for i in G.nodes():
        if (i[0]+1,i[1]+1) in G.nodes():
            G.add_edge(i,(i[0]+1,i[1]+1))
    for i in G.nodes():
        if (i[0]-1,i[1]+1) in G.nodes():
            G.add_edge(i,(i[0]-1,i[1]+1))
    return G

#calculate ai on a directed tree
def ai(T):
    T1 = T.copy()
    s = T.reverse()
    a = defaultdict(lambda:0)
    while T1.edges():
        n = [i for i in T1 if not T1[i]]
        m = [(i, s[i].keys()[0]) for i in n]
        for i,j in m:
            a[i]+=1
            a[j]+=a[i]
        T1.remove_nodes_from(n)
    return a

# rewire a directed tree
def rewire(T,start):
    T1 = T.copy()
    s = T.reverse()
    k = random.choice([i for i in T1.nodes() if i != start])
    v=[(0,1),(0,-1),(1,0),(1,1),(1,-1),(-1,0),(-1,1),(-1,-1)]
    f = [(k[0]+x,k[1]+y) for x, y in v]
    up = s[k].keys()[0]
    used = [up]
    if T1[k]:
        used+= T1[k].keys()
    newup = random.choice([i for i in f if i in T1 and i not in used])
    T1.remove_edge(up,k)
    T1.add_edge(newup,k)
    return T1

# refreshing results
def flushPrint(variable):
    sys.stdout.write('\r')
    sys.stdout.write('%s' % variable)
    sys.stdout.flush()
画出示意图
生成示意图所需代码
#---------------------------plot demo--------------------------------
fig = plt.figure(figsize=(12, 4),facecolor='white')
#----lattice-------
ax = fig.add_subplot(1,3,1)
L=3
G=grid(L)
pos={i:i for i in G.nodes()}
nx.draw_networkx(G,pos,node_size=50,node_color='RoyalBlue',with_labels=False)
plt.title('Grid',size=14)
plt.axis('off')
#----tree----------
ax = fig.add_subplot(1,3,2)
T = prim(G,(0,0))
A = ai(T)
nx.draw_networkx(T,pos,node_size=50,node_color='RoyalBlue',with_labels=False)
for node in A:
plt.text(node[0]+0.1,node[1],A[node])
plt.title('Minimum spanning tree',size=14)
plt.axis('off')
plt.text(1.5,2.2,'energy = '+ str(np.round(sum(np.array(A.values())0.5),2)),size=12)
#----rewired tree---
ax = fig.add_subplot(1,3,3)
T1 = rewire(T,(0,0))
nx.draw_networkx(T1,pos,node_size=50,node_color='RoyalBlue',with_labels=False)
A1 = ai(T1)
for node in A1:
plt.text(node[0]+0.1,node[1],A1[node])
plt.title('Rewired tree',size=14)
plt.axis('off')
plt.text(1.5,2.2,'energy = '+ str(np.round(sum(np.array(A1.values())0.5),2)),size=12)
#
plt.tight_layout()
plt.show()
#plt.savefig('/Users/csid/Desktop/ocndemo.png',transparent = True)
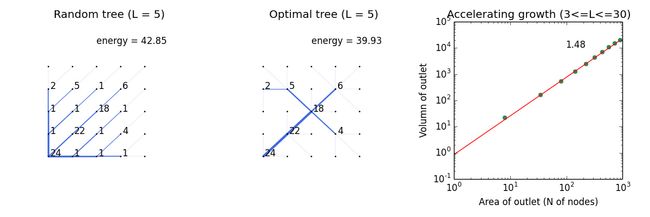
上图展示了经过一千步迭代优化的网络以及优化后的网络随规模增长的统计特征。据Rinaldo等人证明,OCN网络的根节点(图4中图左下角节点)支配的节点数(相当于L^2 - 1)与这些节点上的流量(所有节点i的Ai之和)之间存在超线性增长的幂律关系,幂指数为3/2。
下列代码定义了OCN树的优化,统计量计算,以及画图过程
#------------random tree-----
L=5
G=grid(L)
pos={i:i for i in G.nodes()}
st=(0,0)
T = prim(G,st)
A = ai(T)
#------------optimal tree-----
gamma=0.5
Emin = sum(np.array(A.values())**gamma)
for i in range(1000):
    try:
        flushPrint(i)
        T1 = rewire(T,st)
        A1 = ai(T1)
        E1 = sum(np.array(A1.values())**gamma)
        if E1 < Emin:
            T=T1.copy()
            Emin=E1
    except:
        pass
#------------tree statistics changing with size-----
def Volume(L):
    flushPrint(L)
    gamma=0.5
    st=(0,0)
    G=grid(L)
    T = prim(G,st)
    A = ai(T)
    Emin = sum(np.array(A.values())**gamma)
    for i in range(1000):
        try:
            T1 = rewire(T,st)
            A1 = ai(T1)
            E1 = sum(np.array(A1.values())**gamma)
            if E1 < Emin:
                T=T1.copy()
                Emin=E1
        except:
            pass
    A0 = A1[(0,0)]
    V0 = sum(np.array(A1.values()))
    return (A0,V0)

data=[Volume(i) for i in range(3,33,3)]
size,volume=np.array(data).T

#------------plot--------------
fig = plt.figure(figsize=(12, 4),facecolor='white')
# ----------random spanning tree on a 5*5 lattice----------
T = prim(G,st)
A = ai(T)
ax = fig.add_subplot(1,3,1)
weights=[np.log(A[j])+0.1 for i,j in T.edges()]
nx.draw_networkx(T,pos,node_size=1,arrows=False,width=weights,edge_color='RoyalBlue',with_labels=False)
for node in A:
    if A[node]!=1:
        plt.text(node[0]+0.1,node[1],A1[node])
plt.text(L-3,L,'energy = '+ str(np.round(sum(np.array(A.values())**0.5),2)),size=12)
plt.xlim(-1,L+1)
plt.ylim(-1,L+1)
plt.axis('off')
plt.title('Random tree (L = 5)')
# ----------optimal tree on a 5*5 lattice----------
ax = fig.add_subplot(1,3,2)
A1 = ai(T1)
weights1=[np.log(A1[j])+0.1 for i,j in T1.edges()]
nx.draw_networkx(T1,pos,node_size=1,arrows=False,width=weights1,edge_color='RoyalBlue',with_labels=False)
for node in A1:
    if A1[node]!=1:
        plt.text(node[0]+0.1,node[1],A1[node])
plt.text(L-3,L,'energy = '+ str(np.round(sum(np.array(A1.values())**0.5),2)),size=12)
plt.xlim(-1,L+1)
plt.ylim(-1,L+1)
plt.axis('off')
plt.title('Optimal tree (L = 5)')
# ----------scaling between a0 and c0----------
ax = fig.add_subplot(1,3,3)
alloRegressPlot(x,y,'SeaGreen','o','Area of outlet (N of nodes)','Volumn of outlet')
plt.title('Accelerating growth (3<=L<=30) ')
#
plt.tight_layout()
plt.show()
#plt.savefig('.../scaling.png',transparent = True)
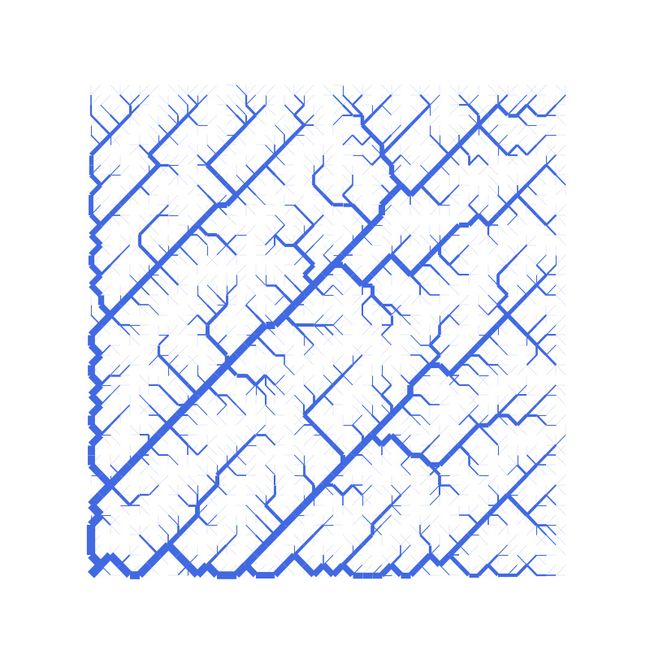
最后,让我们来看一下一个比较大规模的OCN网络的形态。下图展示了在50 x 50的网格上演化一万五千步的情况。虽然已经初步呈现了类似河流网络的分叉结构,但其复杂和优美程度,离大自然的河流网络还是差得很还原。大自然的计算,程序未必有多复杂,但其计算能力,可能还是远远超出了我们现有的水平。
L=50
N=15000#set this to a smaller number if you don't want to wait for a very long time
G=grid(L)
st=(0,0)
T = prim(G,st)
A = ai(T)
gamma=0.5
Emin = sum(np.array(A.values())**gamma)
for i in range(N):
    try:
        flushPrint(i)
        T1 = rewire(T,st)
        A1 = ai(T1)
        E1 = sum(np.array(A1.values())**gamma)
        if E1 < Emin:
            T=T1.copy()
            Emin=E1
    except:
        pass


