单细胞数据分析中,细胞通讯是最重要的一环
当然,已经有了很多的软件用于单细胞数据的通讯分析,比如cellphoneDB,celltalker,cellchat,iTALK等,每个软件都有自己的优缺点,就目前而言,cellphoneDB的引用率最高,效果相对较好,NicheNet也有大文章引用,甚至于cellphoneDB与NicheNet的联合运用。
今天我们来说一下一个新的软件NATMI,相对其他软件而言,有其独有的优势,分析结果更加有利于科研研究,现在我们来看一下
文章在这里Predicting cell-to-cell communication networks using NATMI
首先来看数据库:
NATMI uses connectomeDB2020 (a database of 2293 manually curated ligand-receptor pairs with literature support) to predict and visualise cell-to-cell communication networks from single-cell (or bulk) expression data
一、软件的优势
(1)identify the cell-type pairs that are communicating the most (or most specifically) within a network。
(2)the most active (or specific) ligand-receptor pairs active within a network.
(3)putative highly-communicating cellular communities
(4)differences in intercellular communication when profiling given cell types under different conditions
从软件的优势结果来看,基本涵盖了我们想要的所有分析结果,接下来我们来看看软件的具体介绍与应用。
文献的介绍中提到:
Specifically, NATMI can:
(1) show all cell types predicted to communicate via a user-specified ligand–receptor pair
(2)show all ligand–receptor pairs used for communication between a userspecified pair of cell types
(3)summarise the entire communication network to show how strongly or specifically each cell type in a complex sample communicates to every other cell type, thus identifying highly communicating cell pairs or communities
(4)compare communication networks from two different conditions and identify edges (ligand–receptor pairs) that differ (delta network) between them。
总而言之,一切都是为了做细胞通讯而服务。
二、edge file
这是第一个值得注意的地方
For each analysed dataset NATMI creates an edge file that summarises the levels and fractions of cells in each cell type expressing each ligand and receptor. From this it calculates two different edge weights. The mean-expression edge weights are calculated by multiplying the mean-expression level of the ligand in the sending cell type by the mean expression of the receptor in the target cell type. This weighting is useful to emphasise highly expressed ligands and receptors but provides no discrimination between cell-type-specific and housekeeping edges. The specificity-based edge weights, on the other hand, help identify the most specific edges in the network regardless of expression levels and are calculated as the product of the ligand and receptor specificities, where each specificity is defined as the mean expression of the ligand/receptor in a given cell type divided by the sum of the mean expression of that ligand/receptor across all cell types. The specificity-based edge weights range from 0 to 1 where a weight of 1 means both the ligand and receptor are only expressed in one (not necessarily the same) cell type。
这个地方作者介绍说,edge file包含了细胞类型表达配受体的levels和fraction,基于此计算两种通讯的权重。一种是mean-expression edge weights,就是计算配受体在两种细胞类型中的平均表达值。provides no discrimination between cell-type-specific and housekeeping edges. 另外一种是specificity-based edge weights(特异性权重),不管配受体表达水平,识别细胞类型之间最特异的配受体。至于特异性权重的方法这里写了,我们在后面的方法中讨论。
下面是该软件运用的具体范例。
依据表达权重可以得到如下分析结果,(top20)
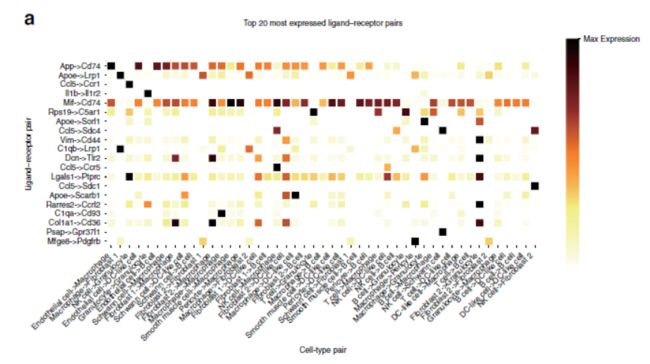
而基于特异性权重分析得到如下结果:

二者之间其实有很大的不同,也就是说,表达水平高的配受体不一定是特异性的配受体,存在互补作用。
三、Cell-connectivity-summary networks.
One of the primary aims of cell-to-cell communication network analysis is to identify which cell types are mutually coordinating their activities by ligand–receptor-mediated communication. Our analyses indicate, however, that all cell types have substantial potential to communicate with each other.Consequently, this leads to the question of which cell types are communicating the most? Or the most specifically? The simplest strategy to measure the degree of communication from one cell type to another is to count the number of ligand–receptor pairs connecting them.
也就是说,我们需要解决的是,对于感兴趣的细胞类型,那种或者哪些细胞类型与其交流最多?或者哪种细胞类型与其交流最特异。Filtering by expression weights can provide users a higher confidence that the ligands and receptors are expressed at sufficient levels.In contrast, filtering on specificity weights highlights a different set of top cell-to-cell pairs.

从图上可以看出,如果基于平均表达的权重,Fibroblast是交流最多的细胞类型,而基于特异性,结果有所不同,内皮细胞特异性交流很多,分析结果之间存在一些区别。
We next compared our results with those obtained by filtering edges based on p values calculated by CellPhoneDB,The resulting heatmap(如下图) is similar to that observed for the expression filtered network。suggesting NATMI may better highlight high specificity edges.Lastly, the network can also be summarised using the summed-specificity weights(这个地方我们在方法中讨论) between each cell type pair。
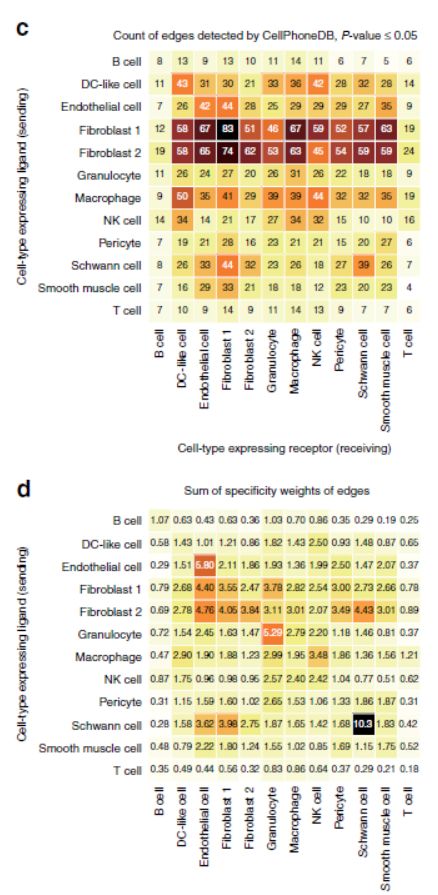
我们建议对大多数分析使用汇总特异性,因为这会捕获细胞类型之间的特定信号。
接下来的部分主要介绍了配受体对在同一细胞类型的表达情况,我们来看一下主要的结论。
autocrine edges had higher rankings, meaning that, on average, autocrine edges tend to be more specific than intra-organ and inter-organ edges。whereas repeated analyses using randomly permuted receptor-ligand pairs abolished these differences(这个地方注意,是cellphoneDB使用的方法)。A slight enrichment was also observed for intra-organ signalling for outgoing plasma-membrane ligand-mediated edges,while no such enrichment was found for the secreted ligandmediated edges and for the plasma-membrane receiving edges。 we conclude that autocrine signalling is a major predicted feature of cell-to-cell communication networks.
这里主要的结论就是,交流最多的就是细胞类型内部之间的交流。
四、Prediction of cellular communities in the Tabula Muris
To examine whether the summed-specificity weighted cellconnectivity-summary networks might help reveal sets of cell types that work together within an organ or to achieve a biological process, we carried out hierarchical clustering of cell types by the vectors of their summed-specificity weights。对于分泌的配体和血浆膜配体介导的网络,这都无法揭示细胞类型到器官,组织或细胞群落的任何潜在簇集。
We next examined the top 10 summed-specificity edges based on the secreted and plasma-membrane ligands and visualised them as cell-connectivity-summary networks which revealed distinct cell communities for both secreted and plasmamembrane ligands(top10的配受体有了明显的划分,如下图)
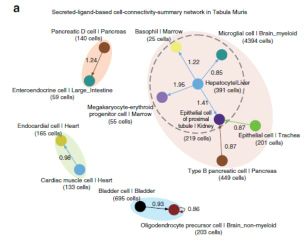
For the connections involving secreted ligands, we observed four disconnected communities。
Examining the most specific ligand–receptor pairs involved in each cellular interaction identified both well-known and novel pairs that appear to be biologically relevant。
其实对于社区的划分我们这里分析用到的可能不是那么的频繁,但是对于真正了解细胞之间的通讯联系的一个新颖角度。
五、Differential network analysis in NATMI.
这也是我们关注的另外一个重点,不同样本之间的通讯差异。
Lastly, we used
NATMI to predict age-related changes in cell communication within the murine mammary gland (mammary glands from 3-and 18-month-old mice profiled in the Tabula Muris Senis42 were compared).鼠乳腺组织不同时期的细胞通讯之间的差异。A simple edge count analysis, at a detection rate threshold of 20%, revealed that there were substantially more ligand–receptor edges predicted as active at 3 months than at 18 months (2045 edges were detected at both ages; 1247 edges were detected at 3 months only; and 340 edges were detected at 18 months only).配受体数量上的差异。Examining differences in the cell-connectivity-summary networks based on the 3- and 18-month-old mammary gland revealed specific cell types were driving these age-related differences。

也就是说,首先分析配受体数量上的差异。(图上展示的是配体数量)。Furthermore, 266 (78.2%) of the 340 edges only detected in the 18-month-old mammary gland involved signalling to or from T and B cells, while only 141 (11.3%) of the 1247 edges exclusively active at 3 months involved lymphocytes.相同细胞类型的配受体比例的差异。Conversely, 613 (49.2%) of the 1247 ligand–receptor edges only detected at 3 months involved signalling to or from basal cells while only 52 (15.6%) of the 340 edges exclusively active at 18 months involved basal cells.这是第一步,分析不同年龄段配受体分析的中相同细胞类型表达配体的数量差异,以及与某种细胞类型表达配受体比例的变化,或者某种细胞类型在配受体表达上的变化。
Examining the basal cell data in more detail identified 9 receptors (Gpc1, Procr, Fzd7, Itga5, Ldlr, Tlr2, Lrp6, Ephb1, and Tfrc) and 8 ligands (Tgfa, Ngf, Col5a2, Il11, Col4a2, Jag1, Col18a1 and Hspg2) at least twofold down-regulated at 18 months。这是第二步,配受体强度的表达变化,Notably, many of these top downregulated ligands and receptors are known to be important in maintenance of normal mammary basal stem cells and are implicated in basal-like and triple negative breast cancer。就是说,样本中同样存在的配受体强度的变化也是研究的一个方向,值得注意。

这个地方的分析思路值得我们借鉴,主要有三点:
(1)不同样本细胞类型之间配受体表达数量上的差异(也关注比例差异),直接决定了通讯的频繁性。
(2)样本之间消失或者新的配受体对的研究,直接反映了不同处理(包括年龄等)细胞交流上生物学功能的差异。
(3)配受体强度的变化,即使配受体存在, 表达强度的下降或者上升也会影响细胞的功能。
六、算法,这里我们只关注权重算法
NATMI outputs weights of edges from a ligandproducing cell type/cluster to a receptor-expressing cell-type/cluster using three metrics.
(1)mean-expression weight,平均表达权重计算为细胞类型/簇中配体的平均表达与细胞类型/簇中受体的平均表达的乘积:
edge(cell-type1→cell-type2)meanligand1-receptor1 = cell-type1mean ligand1 × cell-type2meanreceptor1
(2)specificity weight (特异性权重),calculated as the product of (1) the mean expression of the ligand in a cell type divided by the sum of the mean expression of the ligand across all cell types in the dataset and (2) the mean expression of the receptor in a cell type divided by the sum of the mean expression of the receptor across all cell types in the dataset
edge(cell-type1→celltype2)specificityligand1-receptor1 = cell-type1meanligand1 × (Σ (cell-typemeanligand1))−1 × cell-type2meanreceptor1 × (Σ (cell-typemeanreceptor1))−1.
(3)Cell-connectivity-summary-network edge weights.
To summarise cell-to-cell connectivity within the network, NATMI generates a matrix of cell-connectivity-summary- network edges. These can be weighted by edge-count or summed expression and specificity.Using the ligand–receptor weights described above users can generate edge-count based summaries that simply count the number of ligand–receptor pairs, from cell-type1 to cell-type2, that pass a set of user-defined thresholds. For example, count all pairs observed at a detectionThreshold of 20%, an expressionThreshold of 10CPM, or with a specificityThreshold of 0.1.
说到这里,软件的介绍就已经结束了,软件的运用github在这里,NATMI,大家不妨用一下,个人感觉还是不错的。
请保持愤怒,让王多鱼倾家荡产