TensorBoard是TensorFlow官方推出的可视化工具,它可以将模型训练过程中的各种汇总数据展示出来。我们在使用TensorFlow训练大型深度学习神经网络时,中间的计算过程可能非常复杂,可以使用TensorBoard观察训练过程中的各种可视化数据。它的流程是,在执行TensorFlow计算图的过程中,将各种类型的数据汇总并记录到日志文件中。然后使用TensorBoard读取这些日志文件,解析数据并生成数据可视化Web页面。
用一个MNIST数据集的手写字体识别,看一下各种类型数据的汇总和展示。
先说一下我的环境,我用的是Cuda9.0+Ubuntu16.04+Tensorflow-gpu1.12+Python3.6。
训练过程
import tensorflow as tf
from tensorflow.examples.tutorials.mnist import input_data
max_steps=1000
learning_rate=0.001
dropout=0.9
data_dir='/tmp/tensorflow/mnist/input_data'
#汇总数据的日志存放地址
log_dir='/tmp/tensorflow/mnist/logs/mnist_with_summaries'
# Import data
mnist = input_data.read_data_sets(data_dir,one_hot=True)
sess = tf.InteractiveSession()
# Create a multilayer model.
# Input placeholders
with tf.name_scope('input'):
x = tf.placeholder(tf.float32, [None, 784], name='x-input')
y_ = tf.placeholder(tf.float32, [None, 10], name='y-input')
with tf.name_scope('input_reshape'):
image_shaped_input = tf.reshape(x, [-1, 28, 28, 1])
tf.summary.image('input', image_shaped_input, 10)
# We can't initialize these variables to 0 - the network will get stuck.
def weight_variable(shape):
"""Create a weight variable with appropriate initialization."""
initial = tf.truncated_normal(shape, stddev=0.1)
return tf.Variable(initial)
def bias_variable(shape):
"""Create a bias variable with appropriate initialization."""
initial = tf.constant(0.1, shape=shape)
return tf.Variable(initial)
def variable_summaries(var):
"""Attach a lot of summaries to a Tensor (for TensorBoard visualization)."""
with tf.name_scope('summaries'):
mean = tf.reduce_mean(var)
tf.summary.scalar('mean', mean)
with tf.name_scope('stddev'):
stddev = tf.sqrt(tf.reduce_mean(tf.square(var - mean)))
#进行记录和汇总
tf.summary.scalar('stddev', stddev)
tf.summary.scalar('max', tf.reduce_max(var))
tf.summary.scalar('min', tf.reduce_min(var))
#直接记录变量var的直方图数据
tf.summary.histogram('histogram', var)
def nn_layer(input_tensor, input_dim, output_dim, layer_name, act=tf.nn.relu):
"""Reusable code for making a simple neural net layer.
It does a matrix multiply, bias add, and then uses relu to nonlinearize.
It also sets up name scoping so that the resultant graph is easy to read,
and adds a number of summary ops.
"""
# Adding a name scope ensures logical grouping of the layers in the graph.
with tf.name_scope(layer_name):
# This Variable will hold the state of the weights for the layer
with tf.name_scope('weights'):
weights = weight_variable([input_dim, output_dim])
variable_summaries(weights)
with tf.name_scope('biases'):
biases = bias_variable([output_dim])
variable_summaries(biases)
with tf.name_scope('Wx_plus_b'):
preactivate = tf.matmul(input_tensor, weights) + biases
tf.summary.histogram('pre_activations', preactivate)
activations = act(preactivate, name='activation')
tf.summary.histogram('activations', activations)
return activations
hidden1 = nn_layer(x, 784, 500, 'layer1')
with tf.name_scope('dropout'):
keep_prob = tf.placeholder(tf.float32)
tf.summary.scalar('dropout_keep_probability', keep_prob)
dropped = tf.nn.dropout(hidden1, keep_prob)
# Do not apply softmax activation yet, see below.
y = nn_layer(dropped, 500, 10, 'layer2', act=tf.identity)
with tf.name_scope('cross_entropy'):
# The raw formulation of cross-entropy,
#
# tf.reduce_mean(-tf.reduce_sum(y_ * tf.log(tf.softmax(y)),
# reduction_indices=[1]))
#
# can be numerically unstable.
#
# So here we use tf.nn.softmax_cross_entropy_with_logits on the
# raw outputs of the nn_layer above, and then average across
# the batch.
diff = tf.nn.softmax_cross_entropy_with_logits(logits=y, labels=y_)
with tf.name_scope('total'):
cross_entropy = tf.reduce_mean(diff)
tf.summary.scalar('cross_entropy', cross_entropy)
with tf.name_scope('train'):
train_step = tf.train.AdamOptimizer(learning_rate).minimize(
cross_entropy)
with tf.name_scope('accuracy'):
with tf.name_scope('correct_prediction'):
correct_prediction = tf.equal(tf.argmax(y, 1), tf.argmax(y_, 1))
with tf.name_scope('accuracy'):
accuracy = tf.reduce_mean(tf.cast(correct_prediction, tf.float32))
tf.summary.scalar('accuracy', accuracy)
# Merge all the summaries and write them out to /tmp/mnist_logs (by default)
merged = tf.summary.merge_all()
train_writer = tf.summary.FileWriter(log_dir + '/train', sess.graph)
test_writer = tf.summary.FileWriter(log_dir + '/test')
tf.global_variables_initializer().run()
# Train the model, and also write summaries.
# Every 10th step, measure test-set accuracy, and write test summaries
# All other steps, run train_step on training data, & add training summaries
def feed_dict(train):
"""Make a TensorFlow feed_dict: maps data onto Tensor placeholders."""
if train:
xs, ys = mnist.train.next_batch(100)
k = dropout
else:
xs, ys = mnist.test.images, mnist.test.labels
k = 1.0
return {x: xs, y_: ys, keep_prob: k}
saver = tf.train.Saver()
for i in range(max_steps):
if i % 10 == 0: # Record summaries and test-set accuracy
summary, acc = sess.run([merged, accuracy], feed_dict=feed_dict(False))
test_writer.add_summary(summary, i)
print('Accuracy at step %s: %s' % (i, acc))
else: # Record train set summaries, and train
if i % 100 == 99: # Record execution stats
run_options = tf.RunOptions(trace_level=tf.RunOptions.FULL_TRACE)
run_metadata = tf.RunMetadata()
summary, _ = sess.run([merged, train_step],
feed_dict=feed_dict(True),
options=run_options,
run_metadata=run_metadata)
train_writer.add_run_metadata(run_metadata, 'step%03d' % i)
train_writer.add_summary(summary, i)
saver.save(sess, log_dir+"/model.ckpt", i)
print('Adding run metadata for', i)
else: # Record a summary
summary, _ = sess.run([merged, train_step], feed_dict=feed_dict(True))
train_writer.add_summary(summary, i)
train_writer.close()
test_writer.close()
可视化效果
切换到Linux命令行下,执行TensorBoard程序,并通过--logdir指定TensorFlow日志路径,然后就可以自动生成所有汇总数据可视化的结果了。
tensorboard --logdir=/tmp/tensorflow/mnist/logs/mnist_with_summaries
执行上面的命令后,出现一条提示信息,复制其中的网址到浏览器,就能看到数据可视化的图标了。
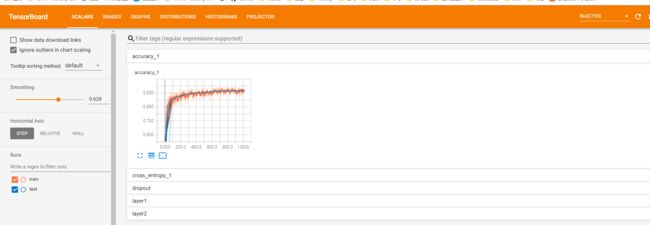
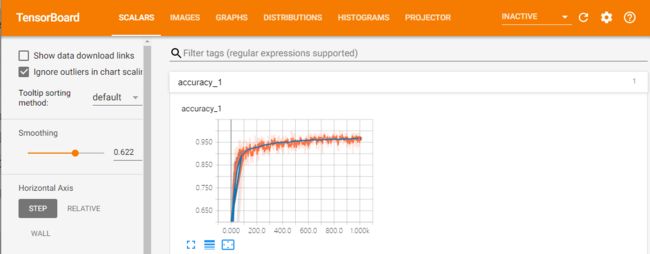
首先打开标量SCALARS的窗口,并单击打开accuracy的图表,其中可以看到两条曲线,分别是train和test中accuracy随训练步数变化的趋势。可以调整Smoothing参数,控制对曲线的平滑处理。如下图所示
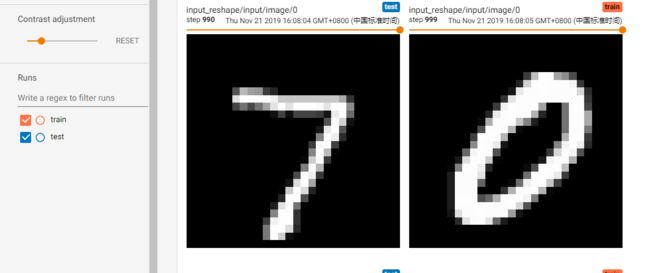
打开IMAGES窗口,可以看到MNIST数据集中的图片,不只是原始数据,所有在tf.summary.image()中汇总的图片数据都可以在这里看到。
进入GRAPHS窗口,可以看到整个TensorFlow计算图的结构,这里展示了网络forward的inference的流程,以及backward训练更新参数的流程
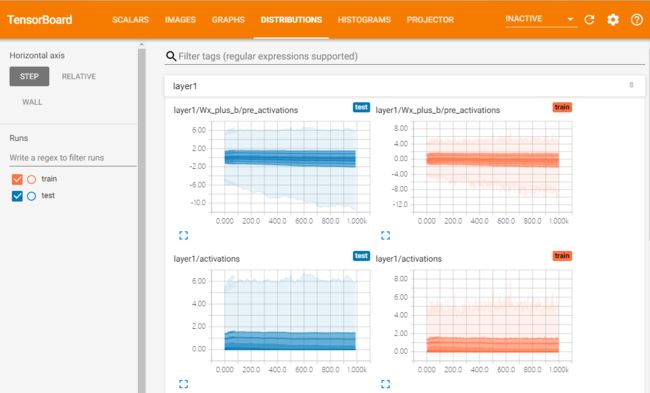
切换到DISTRIBUTIONS窗口,可以看到之前记录的各个神经网络层输出的分布,包括在激活函数前的结果及在激活函数后的结果。这样能观察到神经网络节点的输出是否有效
点击HISTOGRAMS窗口,将DISTRIBUTIONS的图示结构转换为直方图的形式,将每一步训练后的神经网络层的输出的分布以直方图的形式展示出来
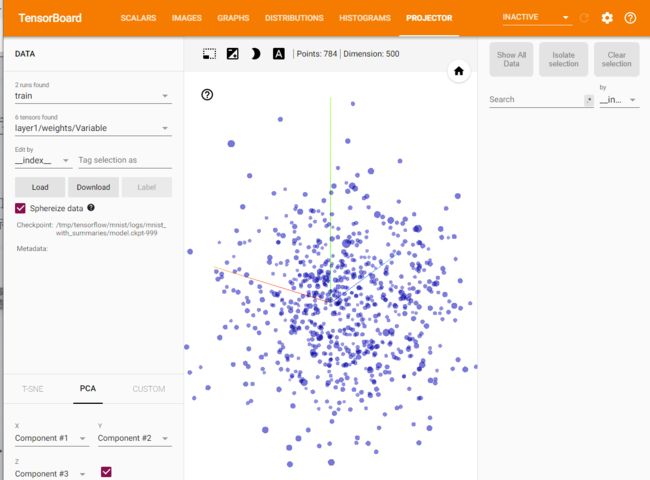
单击PROJECTOR,可以看到降维后的嵌入向量的可视化效果
