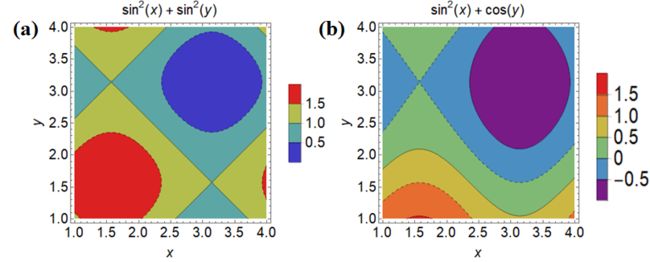
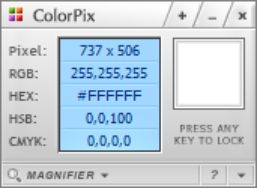
用mathematics画等高线图,两个函数如何有相同图例,查了好久没人提到,觉得有必要总结下。核心的思想很简单,就是一个自动生成图例,然后colorpix屏幕取色,用取第一幅的图例填充第二幅图。
举例:
1. 画下面两个函数的等高线图
函数1 code:
ContourPlot[Sin[x]^2 + Sin[y]^2, {x, 1, 4}, {y, 1, 4},
 Contours -> {0, 0.5, 1.0, 1.5}, ContourStyle -> {1, Dashed},
 ColorFunction -> "Rainbow", PlotLegends -> Automatic,
 FrameLabel -> {{y, None}, {x, Sin[x]^2 + Sin[y]^2}},
 LabelStyle -> Directive[Black, 20]]
函数2 code:
ContourPlot[Sin[x]^2 + Cos[y], {x, 1, 4}, {y, 1, 4},
 Contours -> {-0.5, 0, 0.5, 1.0, 1.5}, ContourStyle -> {1, Dashed},
 ColorFunction -> "Rainbow", PlotLegends -> Automatic,
 FrameTicksStyle -> 20,
 FrameLabel -> {{y, None}, {x, Sin[x]^2 + Cos[y]}},
 LabelStyle -> Directive[Black, 20]]
- 我们用ColorPix小软件提取函数2的图例RGB颜色。
红RGBColor[191, 29, 29] 橙RGBColor[230, 109, 47] 黄RGBColor[203, 184,
66] 绿RGBColor[128, 185, 116] 蓝RGBColor[120, 27, 134] 紫RGBColor[75, 142, 193]
提取完后,图1ColorFunction 就不用 "Rainbow",改为对应颜色。
3. 更改后图1Code:
ContourPlot[Sin[x]^2 + Sin[y]^2, {x, 1, 4}, {y, 1, 4},
 Contours -> {0, 0.5, 1.0, 1.5}, ContourStyle -> {1, Dashed},
 ContourShading -> {RGBColor[128/255, 185/255, 116/255],
   RGBColor[203/255, 184/255, 66/255],
   RGBColor[230/255, 109/255, 47/255],
   RGBColor[191/255, 29/255, 29/255]}, PlotLegends -> Automatic,
 FrameTicksStyle -> 20,
 FrameLabel -> {{y, None}, {x, Sin[x]^2 + Sin[y]^2}},
 LabelStyle -> Directive[Black, 20]]
好的,两幅图可以共用1个图例啦!
总结以下:
1. colorpix取到的RGB在mathematics里要归一,每个值/255.
2. 配色Rainbow不喜欢,可以选,内置好多种。
3.还是没有满意的,嫌直男审美的,推荐个网站自己配色吧!
https://uigradients.com/#GradeGrey
https://galactic.ink/sphere/


