数据集:不同地区居民消费数据
数据集:不同地区居民消费数据
包含内容:均值、方差、标准差、变异系数、偏度、峰度、中位数、上、下四分位数、四分位极差、三均值、直方图、茎叶图、箱线图、相关性分析、正态性分析与检验。
数据集
| 年份 | 全国居民 | 农村居民 | 城镇居民 |
|---|---|---|---|
| 1978 | 184 | 138 | 405 |
| 1979 | 207 | 158 | 434 |
| 1980 | 236 | 178 | 496 |
| 1981 | 262 | 199 | 562 |
| 1982 | 284 | 221 | 576 |
| 1983 | 311 | 246 | 603 |
| 1984 | 354 | 283 | 662 |
| 1985 | 437 | 347 | 802 |
| 1986 | 485 | 376 | 920 |
| 1987 | 550 | 417 | 1089 |
| 1988 | 693 | 508 | 1431 |
| 1989 | 762 | 553 | 1568 |
| 1990 | 803 | 571 | 1686 |
| 1991 | 896 | 621 | 1925 |
| 1992 | 1070 | 718 | 2356 |
| 1993 | 1331 | 855 | 3027 |
| 1994 | 1746 | 1118 | 3891 |
| 1995 | 2336 | 1434 | 4874 |
| 1996 | 2641 | 1768 | 5430 |
| 1997 | 2834 | 1876 | 5796 |
| 1998 | 2972 | 1895 | 6217 |
| 1999 | 3180 | 1973 | 6651 |
导包
import numpy as np
import pandas as pd
import scipy.stats as st
import matplotlib.pyplot as plt
from itertools import groupby
导入数据
costData = pd.read_excel('1.3.xlsx') #读入Excel文件
预处理数据
cost = np.array(costData.iloc[:,1:4].astype('float')) # 除去年份数据
计算均值、方差、标准差、变异系数、偏度、峰度
print('均值',np.mean(cost,axis=0))
print('方差',np.var(cost,axis=0))
print('标准差',np.std(cost,axis=0))
print('变异系数',np.std(cost,axis=0)*100 / np.mean(cost,axis=0))
print('偏度',st.skew(cost,axis=0))
print('峰度',st.kurtosis(cost,axis=0))
结果:
均值 [1117.          747.86363636 2336.40909091]
方差 [ 984785.72727273  381506.84504132 4329948.42355372]
标准差 [ 992.36370715  617.66240378 2080.8528116 ]
变异系数 [88.84187172 82.59024423 89.06200629]
偏度 [0.95360413 0.94217221 0.90300153]
峰度 [-0.62060385 -0.61604297 -0.71180455]
计算中位数、上、下四分位数、四分位极差、三均值
print('中位数',np.median(cost,axis=0))
print('上四分位数',np.quantile(cost,0.75,axis=0))
print('下四分位数',np.quantile(cost, 0.25,axis=0))
print('四分位极差',np.quantile(cost,0.75,axis=0)-np.quantile(cost, 0.25, axis=0))
print('三均值',np.median(cost,axis=0)/2+np.quantile(cost,0.75,axis=0)/4+np.quantile(cost, 0.25, axis=0)/4)
结果:
中位数 [ 727.5  530.5 1499.5]
上四分位数 [1642.25 1052.25 3675.  ]
下四分位数 [321.75 255.25 617.75]
四分位极差 [1320.5   797.   3057.25]
三均值 [ 854.75    592.125  1822.9375]
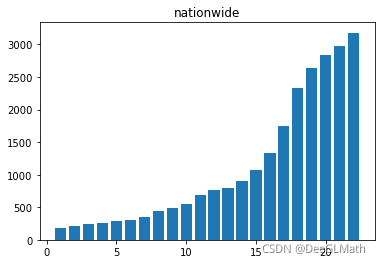
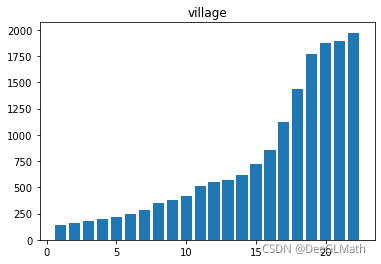
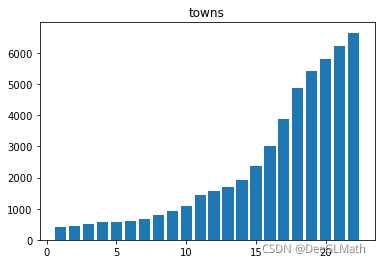
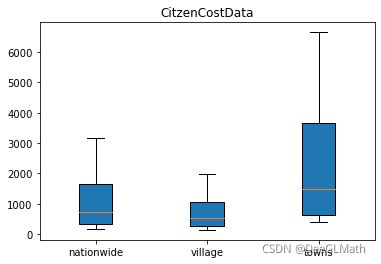
作出直方图、茎叶图、箱线图
直方图
blt = plt.bar(list(range(1,22+1)), cost[:,0]);
plt.title('nationwide');
plt.show();

blt = plt.bar(list(range(1,22+1)), cost[:,1]);
plt.title('village');
plt.show();

blt = plt.bar(list(range(1,22+1)), cost[:,2]);
plt.title('towns');
plt.show();
茎叶图
for i in range(3):
    for k, g in groupby(sorted(cost[:,i].astype(int)), key=lambda x: int(x) // 10):
        lst = map(str, [int(y) % 10 for y in list(g)])
        print (k, '|', ' '.join(lst))
    print('\t')
全国居民:
18 | 4
20 | 7
23 | 6
26 | 2
28 | 4
31 | 1
35 | 4
43 | 7
48 | 5
55 | 0
69 | 3
76 | 2
80 | 3
89 | 6
107 | 0
133 | 1
174 | 6
233 | 6
264 | 1
283 | 4
297 | 2
318 | 0
农村居民:
13 | 8
15 | 8
17 | 8
19 | 9
22 | 1
24 | 6
28 | 3
34 | 7
37 | 6
41 | 7
50 | 8
55 | 3
57 | 1
62 | 1
71 | 8
85 | 5
111 | 8
143 | 4
176 | 8
187 | 6
189 | 5
197 | 3
城镇居民:
40 | 5
43 | 4
49 | 6
56 | 2
57 | 6
60 | 3
66 | 2
80 | 2
92 | 0
108 | 9
143 | 1
156 | 8
168 | 6
192 | 5
235 | 6
302 | 7
389 | 1
487 | 4
543 | 0
579 | 6
621 | 7
665 | 1
箱线图
blt = plt.boxplot(cost, notch=False, sym='o',vert=True, patch_artist=True);
plt.xticks((1,2,3),('nationwide','village','towns'))
plt.title('CitzenCostData')
plt.show()
作出相关性分析
print(costData[['全国居民','农村居民','城镇居民']].corr())
结果:
         全国居民      农村居民      城镇居民
全国居民  1.000000  0.998566  0.998979
农村居民  0.998566  1.000000  0.996380
城镇居民  0.998979  0.996380  1.000000
进行正态性分析和检验
for i in range(3):
    print('正态性检验',st.kstest(cost[:,i], 'norm',(np.mean(cost[:,i]), np.std(cost[:,i])),alternative='less'))
结果:
正态性检验 KstestResult(statistic=0.17356275124497994, pvalue=0.2376239957646608)
正态性检验 KstestResult(statistic=0.16172972700034527, pvalue=0.2853389966713887)
正态性检验 KstestResult(statistic=0.17665671370514657, pvalue=0.22605042482043552)
结论:
p p p值大于0.05,故接受假设:三种数据均服从正态分布。


