python3——matplotlib绘图2
7、使用scatter()绘制散点图或气泡图
8、使用boxplot()绘制箱形图
9、使用polar()绘制雷达图
7、使用scatter()绘制散点图或气泡图
实例7:汽车速度与制动距离的关系
def scatter():
    y = [0.5, 2.0, 4.4, 7.9, 12.3,
        17.7, 24.1, 31.5, 39.9, 49.2,
        59.5, 70.8, 83.1, 96.4, 110.7,
        126.0, 142.2, 159.4, 177.6, 196.8]
    #x = np.linspace(1, len(y), len(y))  # np.linspace(start,stop,num)
    #x = np.arange(1, len(y) + 1)
    x = list(range(10,210,10))
    plt.figure()
    plt.title('汽车速度与制动距离的关系')
    plt.scatter(x,y)
    plt.show()
8、使用boxplot()绘制箱形图
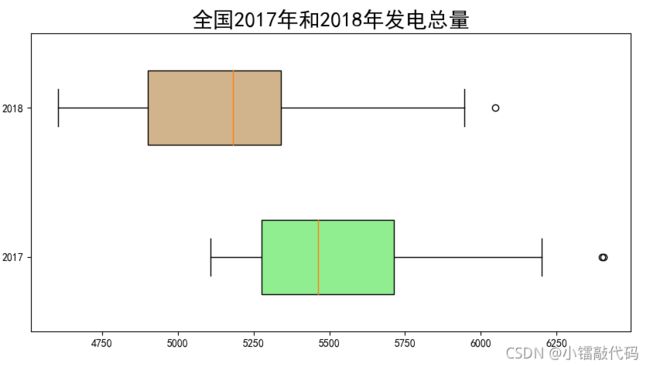
案例8:全国2017年和2018年发电总量
# 箱形图boxplot()
def boxplot():
    y1 = np.array([5200, 5254.5, 5283.4, 5107.8, 5443.3, 5550.6,
     6400.2, 6404.9, 5483.1, 5330.2, 5543, 6199.9])
    y2 = np.array([4605.2, 4710.3, 5168.9, 4767.2, 4947, 5203,
    6047.4, 5945.5, 5219.6, 5038.1, 5196.3, 5698.6])
    plt.figure(figsize=(10, 5))  # 设置画布的尺寸
    plt.title('全国2017年和2018年发电总量', fontsize=20)  # 标题,并设定字号大小
    labels = '2017', '2018'  # 图例
    box = plt.boxplot([y1, y2], labels=labels,meanline=True,widths=0.5,patch_artist=True, vert=False)  # grid=False:代表不显示背景中的网格线
    colors = ['lightgreen', 'tan', 'pink','cyan', 'lightblue']
    for patch, color in zip(box['boxes'], colors):
        patch.set_facecolor(color)
    plt.show()  # 显示图像
9、使用polar()绘制雷达图
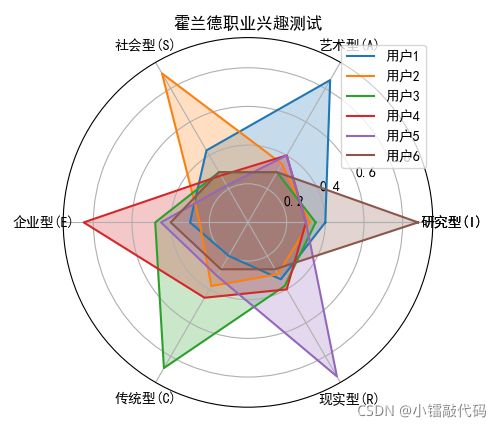
案例9:霍兰德职业兴趣测试
def polar():
    dim_num = 6
    data = np.array([[0.40, 0.32, 0.35, 0.30, 0.30, 0.88],
                     [0.85, 0.35, 0.30, 0.40, 0.40, 0.30],
                     [0.43, 0.89, 0.30, 0.28, 0.22, 0.30],
                     [0.30, 0.25, 0.48, 0.85, 0.45, 0.40],
                     [0.20, 0.38, 0.87, 0.45, 0.32, 0.28],
                     [0.34, 0.31, 0.38, 0.40, 0.92, 0.28]])

    # 构建角度和值   生成等差元组
    angles = np.linspace(0, 2 * np.pi, dim_num, endpoint=False)

    # 数组拼接
    angles = np.concatenate((angles, [angles[0]]))
    data = np.concatenate((data, [data[0]]))

    # 维度标签
    radar_labels = ['研究型(I)', '艺术型(A)', '社会型(S)',
                    '企业型(E)', '传统型(C)', '现实型(R)']
    radar_labels = np.concatenate((radar_labels, [radar_labels[0]]))

    # 绘制雷达图
    plt.polar(angles, data)
    plt.legend(["用户1", "用户2","用户3","用户4","用户5","用户6"], loc='best')

    # 设置极坐标的标签
    plt.thetagrids(angles * 180 / np.pi, labels=radar_labels)

    # 填充多边形,设置透明度为 0.25
    plt.fill(angles, data, alpha=0.25)
    plt.title('霍兰德职业兴趣测试')
    plt.show()


