python股票量化分析
使用tushare包的get_k_data()函数来获取股票交易数据,具体可以通过命令help(ts.get_k_data)了解函数和参数含义。
import pandas as pd
import numpy as np
import matplotlib.pyplot as plt
#正常显示画图时出现的中文
from pylab import mpl
#这里使用微软雅黑字体
mpl.rcParams['font.sans-serif']=['SimHei']
#画图时显示负号
mpl.rcParams['axes.unicode_minus']=False
import seaborn as sns  #画图用的
import tushare as ts
#Jupyter Notebook特有的magic命令
#直接在行内显示图形
%matplotlib inline
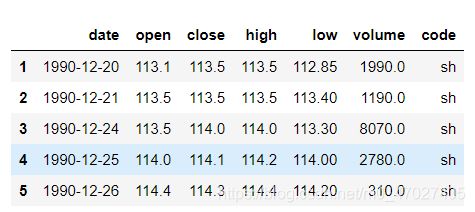
查看表中的前五行
sh=ts.get_k_data(code='sh',ktype='D',
  autype='qfq', start='1990-12-20')
#code:股票代码,个股主要使用代码,如‘600000’
#ktype:'D':日数据;‘m’:月数据,‘Y’:年数据
#autype:复权选择,默认‘qfq’前复权
#start:起始时间
#end:默认当前时间
#查看下数据前5行
sh.head(5)
将数据列表中的第0列’date’设置为索引
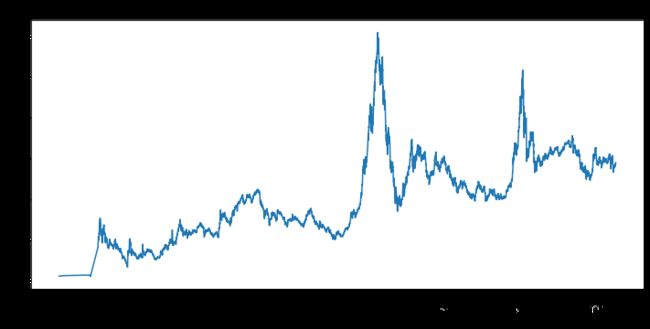
画出上证指数收盘价的走势
sh.index=pd.to_datetime(sh.date)
sh['close'].plot(figsize=(12,6))
plt.title('上证指数1990-2018年走势图')
plt.xlabel('日期')
plt.show()
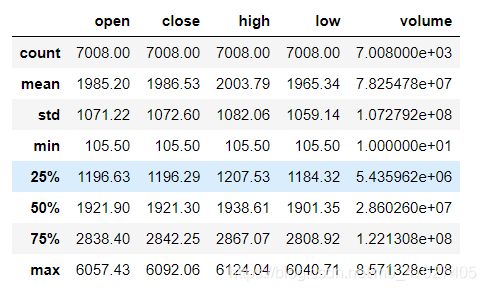
sh.describe().round(2)
再查看下每日成交量
2006年市场容量小,交易量比较小,我们从2007年开始看
sh.loc["2007-01-01":]["volume"].plot(figsize=(12,6))
plt.title('上证指数2007-2018年日成交量图')
plt.xlabel('日期')
plt.show()
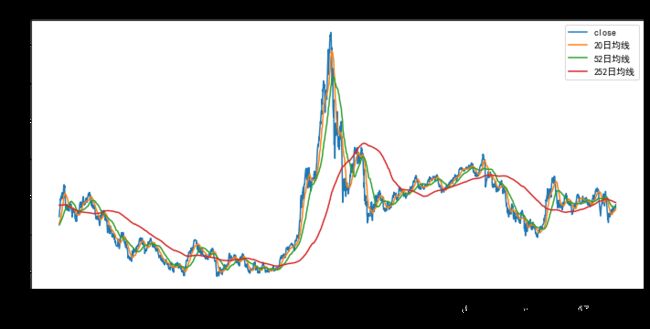
画出2010年以来收盘价和均线图
ma_day = [20,52,252]

for ma in ma_day:
    column_name = "%s日均线" %(str(ma))
    sh[column_name] =sh["close"].rolling(ma).mean()
#sh.tail(3)
sh.loc['2010-10-8':][["close",
"20日均线","52日均线","252日均线"]].plot(figsize=(12,6))
plt.title('2010-2018上证指数走势图')
plt.xlabel('日期')
plt.show()
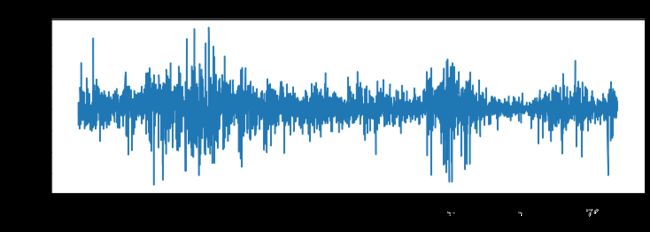
sh["日收益率"] = sh["close"].pct_change()
sh["日收益率"].loc['2005-01-01':].plot(figsize=(12,4))
plt.xlabel('日期')
plt.ylabel('收益率')
plt.title('2005-2018年上证指数日收益率')
plt.show()
sh["日收益率"].loc['2014-01-01':].plot(figsize=
(12,4),linestyle="--",marker="o",color="g")
plt.title('2014-2018年日收益率图')
plt.xlabel('日期')
plt.show()
#分析下常见的几个股票指数
stocks={
     '上证指数':'sh','深证指数':'sz','沪深300':'hs300',
        '上证50':'sz50','中小板指':'zxb','创业板':'cyb'}
stock_index=pd.DataFrame()
for stock in stocks.values():
    stock_index[stock]=ts.get_k_data(stock,ktype='D',
autype='qfq', start='2005-01-01')['close']
#stock_index.head()
#计算这些股票指数每日涨跌幅
tech_rets = stock_index.pct_change()[1:]
#tech_rets.head()
#收益率描述性统计
tech_rets.describe()
#结果不在此报告
#均值其实都大于0
tech_rets.mean()*100 #转换为%
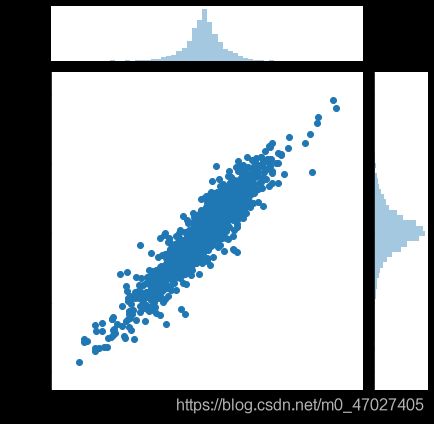
sns.jointplot('sh','sz',data=tech_rets)
df=ts.get_k_data('sh',ktype='D', autype='qfq',
                 start='2005-01-01')
df.index=pd.to_datetime(df.date)
tech_rets = df.close.pct_change()[1:]
rets = tech_rets.dropna()
#rets.head()
#下面的结果说明,我们95%的置信,一天我们不会损失超过0.0264...
rets.quantile(0.05)
-0.026496813699825043
def monte_carlo(start_price,days,mu,sigma):
    dt=1/days
    price = np.zeros(days)
    price[0] = start_price
    shock = np.zeros(days)
    drift = np.zeros(days)

    for x in range(1,days):
        shock[x] = np.random.normal(loc=mu * dt,
                scale=sigma * np.sqrt(dt))
        drift[x] = mu * dt
        price[x] = price[x-1] + (price[x-1] *
                (drift[x] + shock[x]))
    return price
#模拟次数
runs = 10000
start_price = 2641.34 #今日收盘价
days = 252
mu=rets.mean()
sigma=rets.std()
simulations = np.zeros(runs)

for run in range(runs):
    simulations[run] = monte_carlo(start_price,
      days,mu,sigma)[days-1]
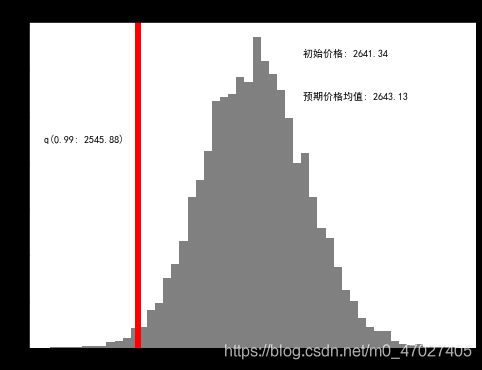
q = np.percentile(simulations,1)
plt.figure(figsize=(8,6))
plt.hist(simulations,bins=50,color='grey')
plt.figtext(0.6,0.8,s="初始价格: %.2f" % start_price)
plt.figtext(0.6,0.7,"预期价格均值: %.2f" %simulations.mean())
plt.figtext(0.15,0.6,"q(0.99: %.2f)" %q)
plt.axvline(x=q,linewidth=6,color="r")
