(有监督)Python实现Logistic回归算法(学习笔记)
一、前言
数据挖掘十大算法–logistic算法。广义的线性回归分析模型,常用于数据挖掘,疾病自动诊断,经济预测等领域,实际上是一种分类方法,主要用于两分问题。逻辑回归主要解决的问题是:面对一个回归或者分类问题,建立代价函数,然后通过优化方法迭代求解出最优的模型参数,然后测试验证我们这个求解的模型的好坏。
logistic算法虽然简单,但是很经典,对于后续有监督学习算法的学习理解会有很大的帮助。
FLAG:以后相关的机器学习算法都要自己编程实现,然后和相关的库函数实现做一个对比。
二、实验环境
- python3.6.4
- IDE:Pycharm 2018
- 操作系统:windows10
- 吴恩达逻辑回归数据集
- 依赖库:scipy,matplotlib, numpy,pandas,sklearn
三、Logistic回归的基本原理
###3.1、算法简介
logistic回归算法原理:面对一个回归或者分类问题,建立代价函数,然后通过优化方法迭代求解出最优的模型参数,然后测试验证我们这个求解的模型的好坏。
logistic回归算法的关键之处在于:
- 寻找决策面函数
- 构造代价函数
- 利用数值寻优算法来迭代代价函数,从而得到优化参数值
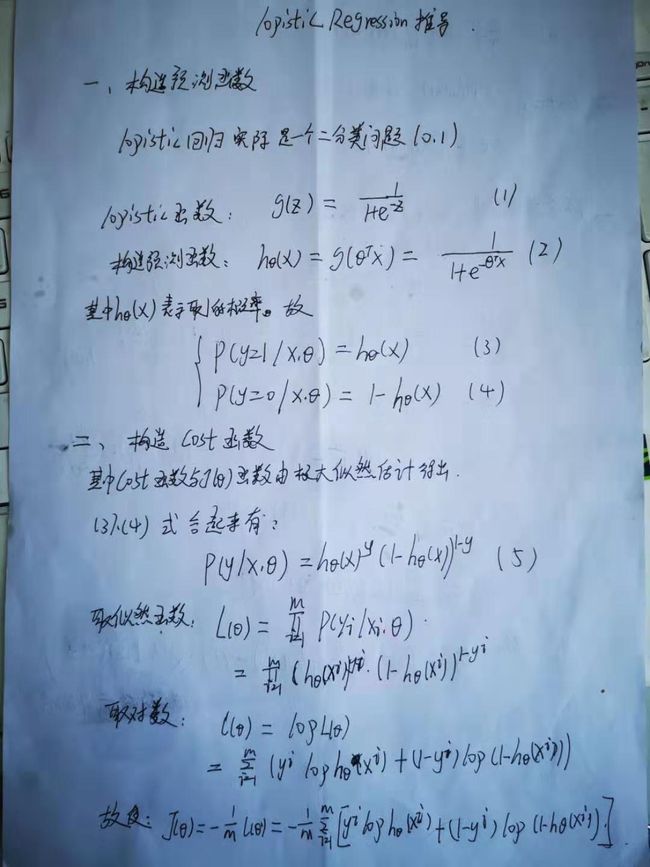
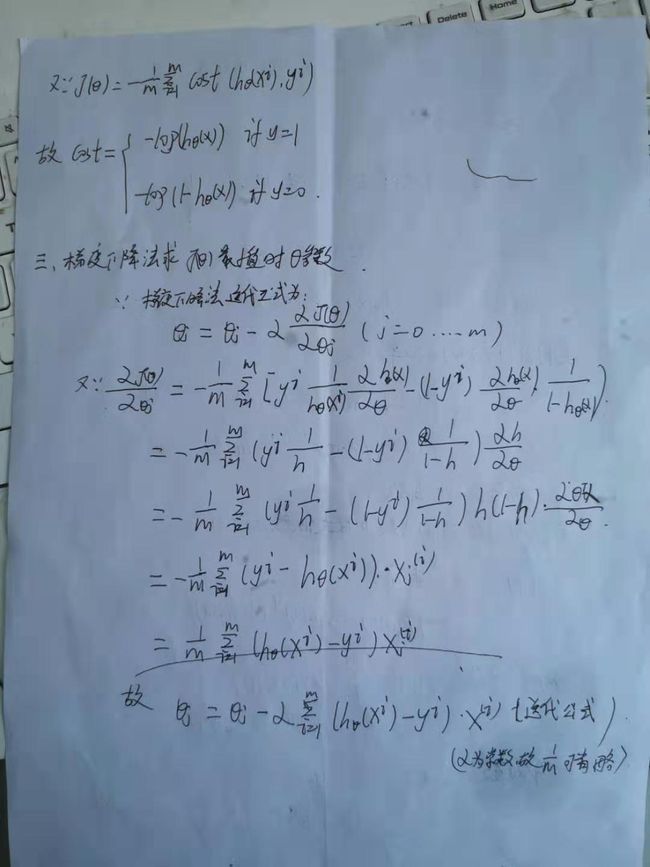
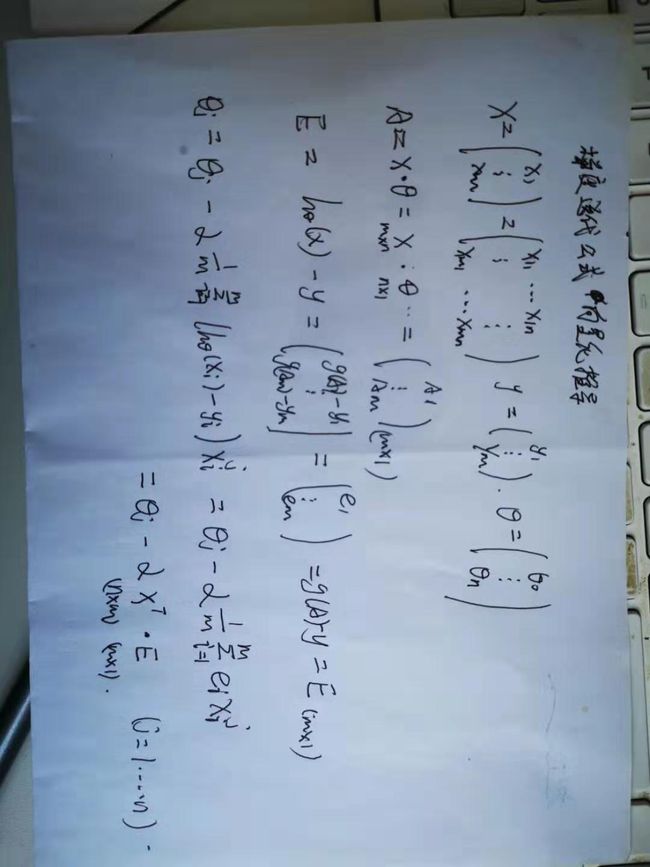
###3.2、数学推导过程
具体的推导过程过程如下:
###3.3、行业应用
- 1、预测
- 2、找关键影响因素
- 3、二分类问题
###3.3、算法迭代步骤
- step1:数据预处理,划分训练集和测试集,并根据需求标准化或者归一化数据集(预处理)
- step2:根据特征分布来确定决策面方程形式(一般为多项式)
- step3:根据代价函数,利用相应优化算法(梯度法等)迭代出方程参数
- step4:根据决策面函数来进行预测或者是分类
- step5:计算分类的准确率(模型评估)
四、logistic回归算法的编程实现(python)
本实例用到得到实验数据为吴恩达机器学习课程上关于logitic回归的数据集(数据集为1003的形式,包括1002的特征以及100*1的二分类结果),并且对数据进行分割,从而形成训练集和测试集。
我们下面的实现,主要是分为三个部分:
- 1、利用梯度下降法,纯编程实现(帮助理解算法实现过程)
- 2、利用python的scipy.optimize模块,使用共轭梯度法来迭代实现
- 3、利用python的sklearn.linear_model.LogisticRegression模块来实现(最简单实用)
利用梯度下降法,纯编程实现的脚本如下:
#!/usr/bin/env python
# -*- coding:utf-8 -*-
import pandas as pd
import numpy as np
import matplotlib.pyplot as plt
from sklearn.model_selection import train_test_split
from sklearn.datasets import load_iris
from sklearn.linear_model import LogisticRegression

# 这两句代码用来正确显示图中的中文字体,后续都要加上
plt.rcParams['font.sans-serif']=['SimHei'] #用来正常显示中文标签
plt.rcParams['axes.unicode_minus']=False #用来正常显示负号

data = pd.read_csv('https://myblog-wss.oss-cn-hongkong.aliyuncs.com/logistic/ex2data1.txt',
                   names = ['exam1','exam2','adm'])
#利用pandas布尔索引的得到两类样本,并绘图
postive = data[data.adm == 1]
negetive = data[data.adm == 0]
#数据预处理,选出实际训练使用数据
data = data.values
X = data[:,:-1]
m = X.shape[0]
one = np.ones((m,1))
X = np.hstack((one,data[:,:-1]))
# print(X.shape)
Y = data[:,-1:]

def boundary(theta):
    x1 = np.arange(20,100,0.5)
    x2 = (theta[0,0]+theta[0,1]*x1)/(-theta[0,2])#直线方程为:theta[0] + theta[1]*x1 + theta[2]*x2 = 0
    plt.plot(x1, x2,c = 'r',linewidth = 2,label = '决策边界')
    plt.scatter(postive['exam1'],postive['exam2'],c = '#ff7500',label = '正样本')
    plt.scatter(negetive['exam1'],negetive['exam2'],c = '#725e82',label = '负样本')
    plt.legend()
    plt.show()


'''
使用自己编写的梯度下降(上升)法来处理,吴恩达课后作业数据集
'''

# print(np.mat(Y).shape)

def sigmoid(x):
    return 1.0/(1+np.exp(-x))
def gradascent(xtrain,ytrain,max = 50000,alpha=0.1):
    xtrain_m=np.mat(xtrain)
    ytrain_m=np.mat(ytrain)
    m,n = np.shape(xtrain_m)
    weights = np.ones((n,1))
    for k in range(max):
        h = sigmoid(xtrain_m*weights)
        error = -(ytrain_m-h)
        weights = weights - alpha*xtrain_m.transpose()*error
    return weights

def prediction(theta,x):
    h = sigmoid(np.mat(x)*theta)
    return np.where(h>=0.5,1,0)
def accuracy(pre,y):
    accu = np.mean(pre == y)
    # accu = np.mean([1 if a == b else 0 for (a,b) in zip(pre_y,y)])
    return accu

theta = gradascent(X,Y,max = 500000,alpha=0.001)

print(theta.ravel())
pre_y = prediction(theta,X)
accur = accuracy(pre_y,Y)
print('(梯度下降法迭代自编脚本)logistic分类识别率: ' + repr(accur) + '%')
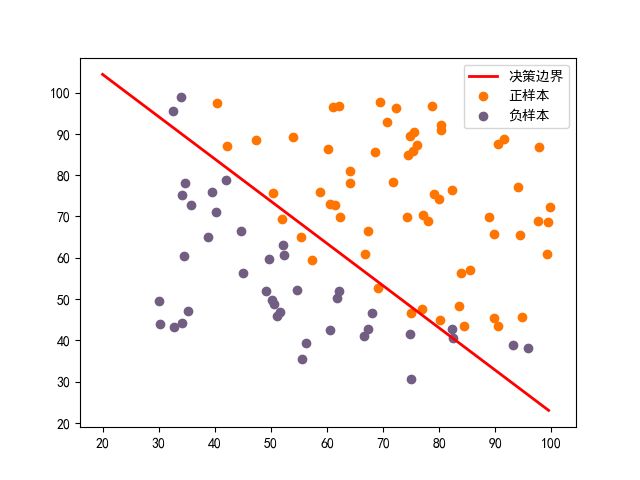
boundary(theta.ravel())
- 脚本输出结果
(machine_learning) D:\CloudMusic\virtualenv\machine_learning\machine>python logistic_sklearn.py
[[-547.63901451    4.73006368    4.61109921]]
(梯度下降法迭代自编脚本)logistic分类识别率: 92.0%
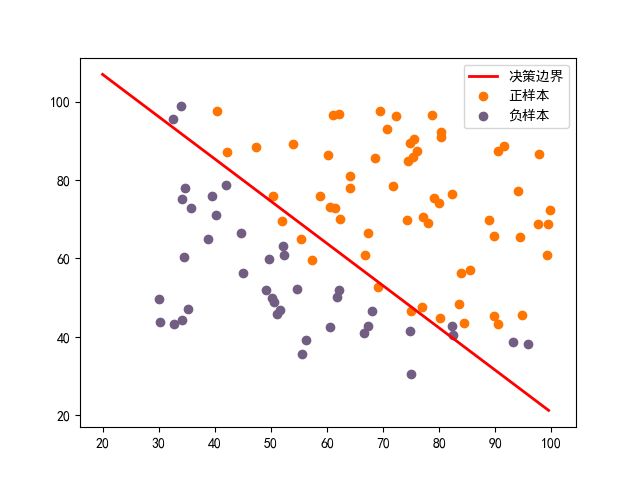
- 脚本分类可视化(仅仅针对二维特征可实现)
上面的代码是自己编程实现的logistic回归算法,下面我们再来直接调用最优化库相关的代码来实现参数优化:
#!/usr/bin/env python
# -*- coding:utf-8 -*-
import numpy as np
import matplotlib.pyplot as plt
import numpy as np
import pandas as pd
import scipy.optimize as opt #引入最优化模块
# import seaborn as sns
from sklearn.model_selection import train_test_split
from sklearn import datasets

# 这两句代码用来正确显示图中的中文字体,后续都要加上
plt.rcParams['font.sans-serif']=['SimHei'] #用来正常显示中文标签
plt.rcParams['axes.unicode_minus']=False #用来正常显示负号
#
data = pd.read_csv('https://myblog-wss.oss-cn-hongkong.aliyuncs.com/logistic/ex2data1.txt',
                   names = ['exam1','exam2','adm'])
#利用pandas布尔索引的得到两类样本,并绘图
postive = data[data.adm == 1]
negetive = data[data.adm == 0]


data = data.values
X = data[:,:-1]
m = X.shape[0]
one = np.ones((m,1))
X = np.hstack((one,data[:,:-1]))
y = data[:,-1:].ravel()

##下面来实现logistic算法

def sigmoid(x):
    return 1./(1.+np.exp(-x))

# x = np.arange(-10,10,0.1)
# plt.plot(x,sigomoid(x),c='#725e82',linewidth = 3)
# plt.show()

#输出概率函数
def out(x,w):
    return sigmoid(np.dot(x,w))

#编写损失函数J(theta)函数,其中theta为优化参数,x是输入向量,y是输出向量
def cost(theta,X,y):
    # h = out(x,theta)
    # J = -1*np.mean(y*np.log(h)+(1-y)*np.log((1-h)))
    # return J
    return -(y.dot(np.log(sigmoid(X.dot(theta)))) + (1 - y).dot(1 - np.log(sigmoid(X.dot(theta))))) / len(y)

#编写梯度计算函数,这里有一个梯度函数向量化的推导要注意看

def grad(theta, x, y):
    # return ((sigomoid(x.dot(theta))-y).T).dot(x)
    g = x.T.dot((out(x, theta) - y)) / len(x)
    # g = grad.ravel()
    return g


#定义预测函数
def prediction(theta,x):
    h = out(x,theta)
    # return [1 if x>=0.5 else 0 for x in h]#返回一个列表
    return np.where(h>=0.5,1,0)

#定义预测准确度函数

def accuracy(pre_y,y):
    accu = np.mean(pre_y == y)
    # accu = np.mean([1 if a == b else 0 for (a,b) in zip(pre_y,y)])
    return accu

# 绘制决策边界
def boundary(theta):
    x1 = np.arange(20,100,0.5)
    x2 = (theta[0]+theta[1]*x1)/(-theta[2])#直线方程为:theta[0] + theta[1]*x1 + theta[2]*x2 = 0
    plt.plot(x1, x2,c = 'r',linewidth = 2,label = '决策边界')
    plt.scatter(postive['exam1'],postive['exam2'],c = '#ff7500',label = '正样本')
    plt.scatter(negetive['exam1'],negetive['exam2'],c = '#725e82',label = '负样本')
    plt.legend()
    plt.show()
# 测试函数编写是否正确
initial_theta = np.zeros(X.shape[1])


##使用最优化模块来学习theta参数,优化算法可选。有个大坑,算法选择为'TNC'牛顿截断法
# scipy’s fmin_tnc doesn’t work well with column or row vector. It expects the parameters to be in an array format.
res = opt.minimize(fun=cost,x0=initial_theta.flatten(),args=(X,y.flatten()),method='tnc',jac=grad)
# result = opt.fmin_tnc(func=cost, x0=theta.flatten(), fprime=grad, args=(X, y.flatten()))
'''
两者的功能是一致的,将多维数组降为一维,但是两者的区别是返回拷贝还是返回视图,np.flatten(0返回一份拷贝,对拷贝所做修改不会影响原始矩阵,
而np.ravel()返回的是视图,修改时会影响原始矩阵
'''
# print(theta.flatten().shape)#二维数组降为一维,因为opt.minimize()的一些参数不支持多维数组,比如向量形式
# print(res_theta.ravel().shape)
# print(res)#打印参数优化结果
res_theta = res.x[:,np.newaxis]#一维数组转化为二维数组
print(res_theta)
# print(cost(res_theta, X, y))
pre = prediction(res_theta,X)
# print(len(pre))
print('使用最优化模块opt.minimize来学习theta参数识别成功率: ' + repr(accuracy(pre.ravel(),y)*100) + '%')

boundary(res_theta)
- 可视化决策面分类效果图
- 实验输出结果(决策面参数以及识别测试成功率)
(machine_learning) D:\CloudMusic\virtualenv\machine_learning\machine>python logistic_regression.py
[[-23.68500523]
 [  0.19862744]
 [  0.18435949]]
使用最优化模块opt.minimize来学习theta参数识别成功率: 89.0%
五、logistic回归算法的scikit-learn库实现
实现的脚本如下:
#!/usr/bin/env python
# -*- coding:utf-8 -*-
import pandas as pd
import numpy as np
import matplotlib.pyplot as plt
from sklearn.model_selection import train_test_split
from sklearn.datasets import load_iris
from sklearn.linear_model import LogisticRegression


# 这两句代码用来正确显示图中的中文字体,后续都要加上
plt.rcParams['font.sans-serif']=['SimHei'] #用来正常显示中文标签
plt.rcParams['axes.unicode_minus']=False #用来正常显示负号

'''
首先研究sklearn包对于吴恩达课后习题的的二分类测试集
class sklearn.linear_model.LogisticRegression(penalty=’l2’, dual=False, tol=0.0001, C=1.0,
fit_intercept=True, intercept_scaling=1, class_weight=None, random_state=None, solver=’liblinear’,
max_iter=100, multi_class=’ovr’, verbose=0, warm_start=False, n_jobs=1)
'''
data = pd.read_csv('https://myblog-wss.oss-cn-hongkong.aliyuncs.com/logistic/ex2data1.txt',
                   names = ['exam1','exam2','adm'])
#利用pandas布尔索引的得到两类样本,并绘图
postive = data[data.adm == 1]
negetive = data[data.adm == 0]
#数据预处理,选出实际训练使用数据
data = data.values
X = data[:,:-1]
m = X.shape[0]
one = np.ones((m,1))
# X = np.hstack((one,data[:,:-1]))
# print(X.shape)
Y = data[:,-1:]

x_train,x_test,y_train,y_test =train_test_split(X, Y, test_size=0.1)
log = LogisticRegression(penalty = 'l2',tol= 1e-8 ,solver ='lbfgs')#给定一个逻辑回归分类器
log.fit(X,Y.ravel())#根据给定的训练数据拟合模型。
score = log.score(x_test,y_test)#测试集与标签的预测准确率
theta = [log.intercept_[0],log.coef_.ravel()[0],log.coef_.ravel()[1]]#获取优化参数结果
print(theta)#打印优化参数
print('机器学习库sklearn.linear_model识别成功率: ' + repr(score*100) + '%')
print(log.n_iter_)#打印迭代次数
def boundary(theta):
    x1 = np.arange(20,100,0.5)
    x2 = (theta[0]+theta[1]*x1)/(-theta[2])#直线方程为:theta[0] + theta[1]*x1 + theta[2]*x2 = 0
    plt.plot(x1, x2,c = 'r',linewidth = 2,label = '决策边界')
    plt.scatter(postive['exam1'],postive['exam2'],c = '#ff7500',label = '正样本')
    plt.scatter(negetive['exam1'],negetive['exam2'],c = '#725e82',label = '负样本')
    plt.legend()
    plt.show()

boundary(theta)
- 使用scikit-learnj机器学习库实现逻辑回归分类的预测实际对比图
- 实验对比(自编脚本和scikit-learnj机器学习库实现的对比)
(machine_learning) D:\CloudMusic\virtualenv\machine_learning\machine>python logistic_sklearn.py
[-25.052193143127443, 0.2053549121857798, 0.20058380395530143]
(梯度下降法迭代自编脚本)logistic分类识别率: 92.0%
机器学习库sklearn.linear_model识别成功率: 90.0%
运行次数:32
根据上述的的实验结果可以看出,自编脚本与scikit-learnj第三方库实现的结果基本一致,存在微小的差异。自编脚本的实验准确度之所以高不是因为梯度下降法好,而是因为采用库实现自带正则化处理,防止过拟合现象的发生,因此准确的说,应该还是scikit-learnj第三方库实现的结果更加可靠。而且采用第三方库只迭代了32次就收敛,而使用梯度下降法则是迭代了50000此,方法好坏显而易见。应用上还是直接调用来的方便和准确。
但是自编也是为了更好的熟悉算法流程。
六、总结
6.1 、Logistic回归算法的主要优点:
- 1、速度快适合用于二分类问题,原理简单,算法迭代速度快,运行效率高;
- 2、容易更新模型,从而吸收新的数据,应用十分广泛,是传统有监督算法的经典。
6.2、Logistic回归算法的主要缺点:
- 1、对数据和场景的适应能力有局限性,不如决策树算法适应性那么强
适用条件与主要用途:
- 1、一般用于二分类问题较多;
- 2、寻找主要的影响因素:这一点和多元线性回归类似,不过因变量是二元变量数据;
- 3、预测:根据决策方程,从而预测某一事件发生的概率;
- 4、判别分类:常用二分类任务
###6.3、logistic回归与多元线性回归的区别
Logistic回归与多重线性回归实际上有很多相同之处,最大的区别就在于它们的因变量不同,其他的基本都差不多。正是因为如此,这两种回归可以归于同一个家族,即广义线性模型(generalizedlinear model)。
这一家族中的模型形式基本上都差不多,不同的就是因变量不同。这一家族中的模型形式基本上都差不多,不同的就是因变量不同。
- 因变量连续,就是多元线性回归问题
- 因变量为二项分布就是logistic回归
- 如果是poisson分布,就是poisson回归问题
七、参考文章链接和推荐的教程
- 机器学习算法–逻辑回归原理介绍
- 逻辑回归-理论篇
- 数据挖掘经典算法:Logistic(逻辑回归) python和sklearn实现
- 预处理数据的方法总结(使用sklearn-preprocessing)
- python之sklearn学习笔记
- sklearn.neighbors.KNeighborsRegressor 函数官方文档
- logistic回归算法-维基百科
- 机器学习算法的随机数据生成
- sklearn API
- sklearn官网
