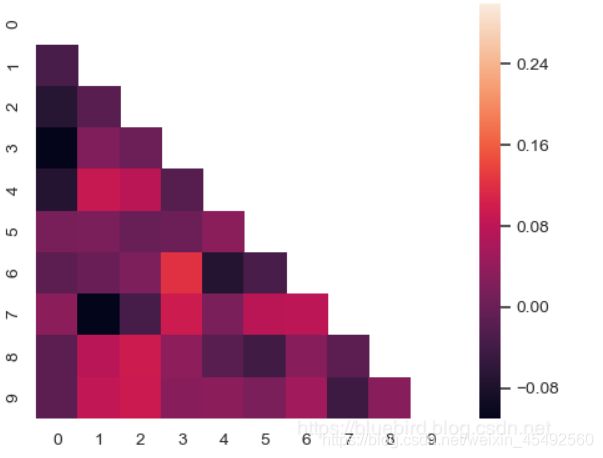
python seaborn.heatmap参数介绍
seaborn.heatmap(data, vmin=None, vmax=None, cmap=None, center=None, robust=False, annot=None, fmt=’.2g’, annotkws=None, linewidths=0, linecolor=‘white’, cbar=True, cbarkws=None, cbar_ax=None, square=False, ax=None, xticklabels=True, yticklabels=True, mask=None, **kwargs)
vmin,vmax:用于指定图例中最小值与最大值的显示值

cmap:指定一个colormap对象,用于热力图的填充色

center:指定颜色中心值,通过该参数可以调整热力图的颜色深浅

annot:指定一个bool类型的值或与data参数形状一样的数组,如果为True,就在热力图的每个单元上显示数值

fmt:指定单元格中数据的显示格式

annot_kws:有关单元格中数值标签的其他属性描述,如颜色、大小等

linewidths :指定每个单元格的边框宽度

linecolor:指定每个单元格的边框颜色

cbar:bool类型参数,是否用颜色条作为图例,默认为True

square:bool类型参数,是否使热力图的每个单元格为正方形,默认为False

cbar_kws:有关颜色条的其他属性描述

xticklabels,yticklabels:指定热力图x轴和y轴的刻度标签,如果为True,则分别以数据框的变量名和行名称作为刻度标签

mask:用于突出显示某些数据

ax:用于指定子图的位置
data:矩阵数据集,可以使numpy的数组(array),如果是pandas的dataframe,则df的index/column信息会分别对应到heatmap的columns和rows
vmax,vmin, 图例中最大值和最小值的显示值,没有该参数时默认不显示
linewidths,热力图矩阵之间的间隔大小
cmap:matplotlib的colormap名称或颜色对象;如果没有提供,默认为cubehelix map (数据集为连续数据集时) 或 RdBu_r (数据集为离散数据集时)
cmap参考的有:

center:将数据设置为图例中的均值数据,即图例中心的数据值;通过设置center值,可以调整生成的图像颜色的整体深浅;设置center数据时,如果有数据溢出,则手动设置的vmax、vmin会自动改变
xticklabels: 如果是True,则绘制dataframe的列名。如果是False,则不绘制列名。如果是列表,则绘制列表中的内容作为xticklabels。 如果是整数n,则绘制列名,但每个n绘制一个label。 默认为True。
yticklabels: 如果是True,则绘制dataframe的行名。如果是False,则不绘制行名。如果是列表,则绘制列表中的内容作为yticklabels。 如果是整数n,则绘制列名,但每个n绘制一个label。 默认为True。默认为True。
annotate的缩写,annot默认为False,当annot为True时,在heatmap中每个方格写入数据(PS:也会显示数字)
annot_kws,当annot为True时,可设置各个参数,包括大小,颜色,加粗,斜体字等
sns.heatmap(x, annot=True, ax=ax1)
sns.heatmap(x, annot=True, ax=ax2, annot_kws={
     'size':9,'weight':'bold', 'color':'blue'})
fmt,格式设置,决定annot注释的数字格式,小数点后几位等
sns.heatmap(x, annot=True, ax=ax1)
sns.heatmap(x, annot=True, fmt='.1f', ax=ax2)
参考链接:https://blog.csdn.net/m0_38103546/article/details/79935671
参考链接:https://www.pythonheidong.com/blog/article/134407/

