graphics | 基础绘图系统(七)——各式各样的散点图/折线图
前面已经用了六篇推文系统地介绍了R语言的基础绘图系统的主要函数用法,以及柱状图、直方图、箱形图、扇形图等常见图形的绘制方法,接下来将计划用四篇推文介绍使用基础绘图系统能够绘制的其他各类图形。
本篇介绍的是各类散点图或折线图,有以下6个函数,这些函数基本上相当于是plot函数某些功能的快捷方式:
dotchart()stripchart()sunflowerplot()matplot()pairs()coplot()
dotchart()
此函数绘制的是克利夫兰点图(Cleveland Dot Plot):
dotchart(x, labels = NULL,
         groups = NULL, gdata = NULL,
         ann = par("ann"), xaxt = par("xaxt"),
         frame.plot = TRUE, log = "",
         cex = par("cex"), pt.cex = cex,
         pch = 21, gpch = 21, bg = par("bg"),
         color = par("fg"), gcolor = par("fg"), lcolor = "gray",
         xlim = range(x[is.finite(x)]),
         main = NULL, xlab = NULL, ylab = NULL, ...)
x为向量或矩阵。
克利夫兰点图是按列绘制各样本的属性散点图,并自动按大小进行排序。
VADeaths[,1:2]
##       Rural Male Rural Female
## 50-54       11.7          8.7
## 55-59       18.1         11.7
## 60-64       26.9         20.3
## 65-69       41.0         30.9
## 70-74       66.0         54.3

dotchart(VADeaths[,1:2], bg = "skyblue")
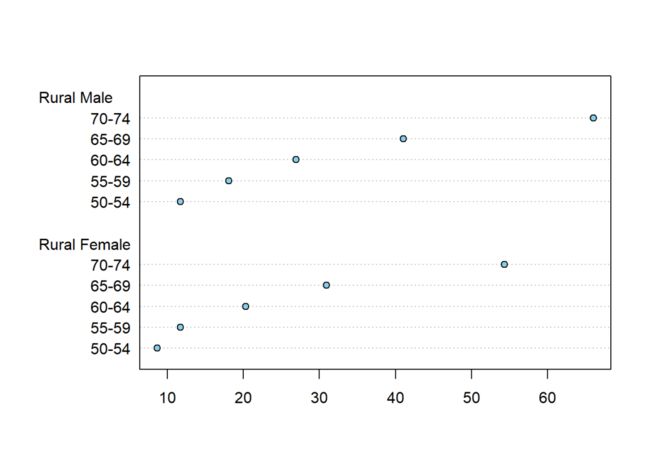
上图年龄组并不是按年龄大小排序(也就是行序)的,而是自动按点对应的属性值的大小进行排序。
stripchart()
该函数绘制的是一维散点图:
stripchart(x, method = "overplot",
           jitter = 0.1, offset = 1/3,
           vertical = FALSE, group.names,
           add = FALSE, at = NULL,
           xlim = NULL, ylim = NULL,
           ylab = NULL, xlab = NULL,
           dlab = "", glab = "",
           log = "", pch = 0, col = par("fg"),
           cex = par("cex"),
           axes = TRUE, frame.plot = axes, ...)
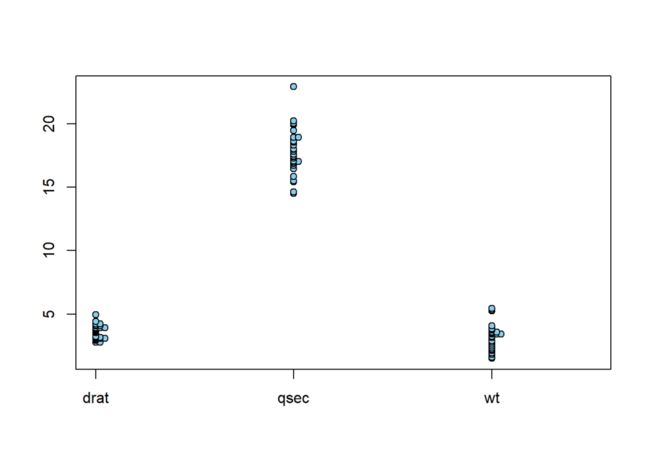
在绘制一维散点图时,可能会面临散点重叠的情况,该函数method参数提供了三种处理方式:overplot(默认值)、jitter、stack。
vertical参数控制绘制方向,默认值FALSE表示水平绘制。
stripchart(mtcars[, c("drat", "qsec", "wt")],
           vertical = T, main = "overplot",
           pch = 21, bg = "skyblue")
stripchart(mtcars[, c("drat", "qsec", "wt")],
           vertical = T, method = "jitter", main = "jitter",
           pch = 21, bg = "skyblue")
stripchart(mtcars[, c("drat", "qsec", "wt")],
           vertical = T, method = "stack", main = "stack",
           pch = 21, bg = "skyblue")
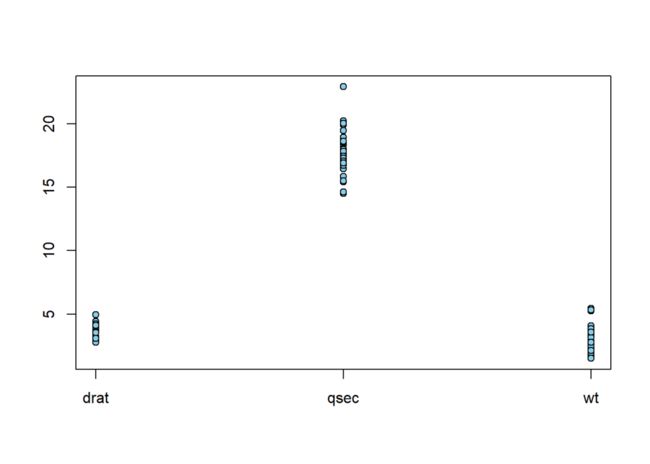 method = "overplot"
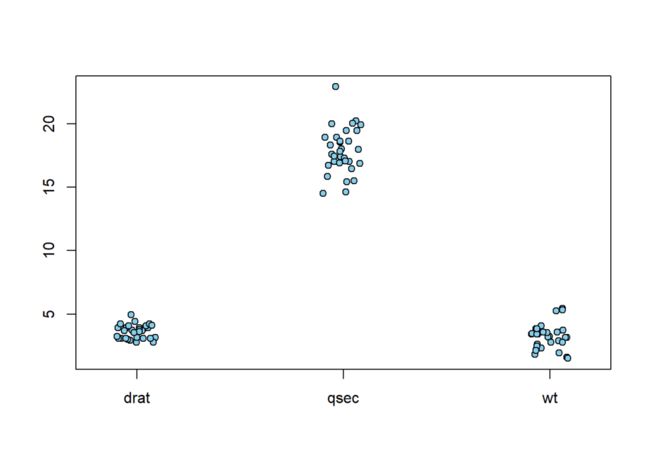 method = "jitter"
 method = "stack"
jitter参数在method = "jitter"时起作用;
offset参数在method = "stack"时起作用。
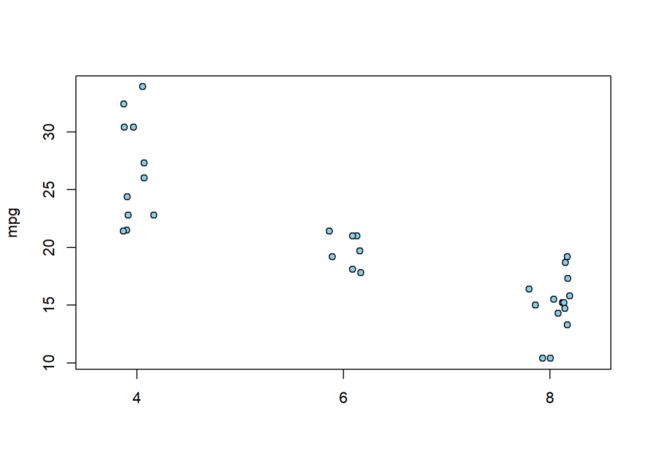
x参数也可以是表达式的形式,并由data参数提供变量:
stripchart(mpg ~ cyl, data = mtcars,
           vertical = T, method = "jitter",
           pch = 21, bg = "skyblue")
sunflowerplot()
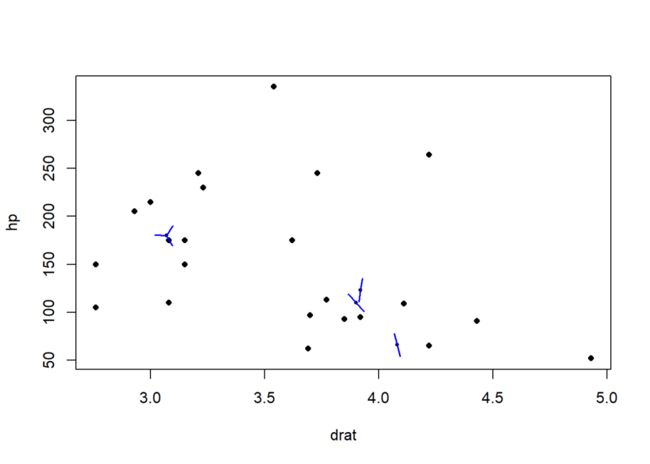
该函数在绘制散点图遇到重叠现象时,会采用花瓣的形式标明重叠点的个数(即花瓣的瓣数):
sunflowerplot(x, y = NULL, number,
              log = "", digits = 6,
              xlab = NULL, ylab = NULL,
              xlim = NULL, ylim = NULL,
              add = FALSE, rotate = FALSE,
              pch = 16, cex = 0.8, cex.fact = 1.5,
              col = par("col"), bg = NA,
              size = 1/8, seg.col = 2,
              seg.lwd = 1.5, ...)
rotate参数会随机旋转花瓣的方向。
seg.col、seg.lwd参数控制花瓣线条的相关属性。
sunflowerplot(mtcars[, c("drat", "hp")],
              seg.col = "blue", rotate = TRUE)
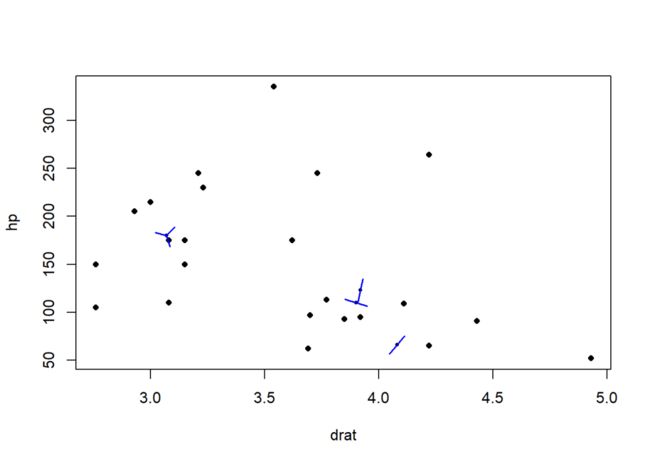
该函数绘制散点图时同样可以使用表达式的形式:
sunflowerplot(hp ~ drat, data = mtcars,
              seg.col = "blue", rotate = TRUE)
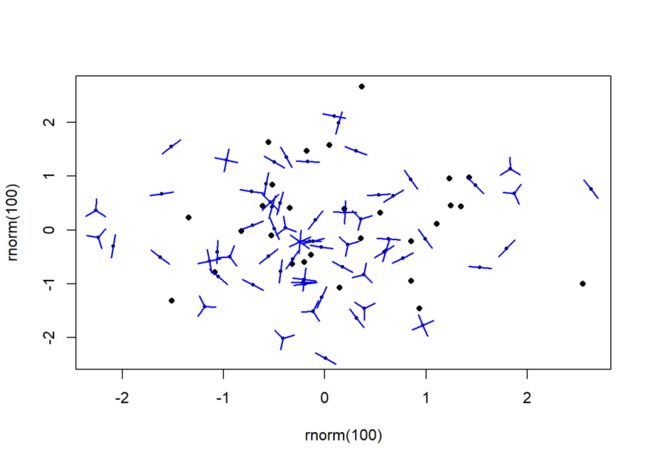
number参数可以指定每个样本点实际代表的点个数(或重复的次数):
sunflowerplot(rnorm(100), rnorm(100),
              number = rpois(n = 100, lambda = 2),
              seg.col = "blue", rotate = TRUE)
matplot()
该函数使用矩阵的形式实现同时绘制多对散点图/折线图的功能:
matplot(x, y, type = "p", lty = 1:5,
        lwd = 1, lend = par("lend"),
        pch = NULL,
        col = 1:6, cex = NULL, bg = NA,
        xlab = NULL, ylab = NULL,
        xlim = NULL, ylim = NULL,
        log = "", ..., add = FALSE,
        verbose = getOption("verbose"))
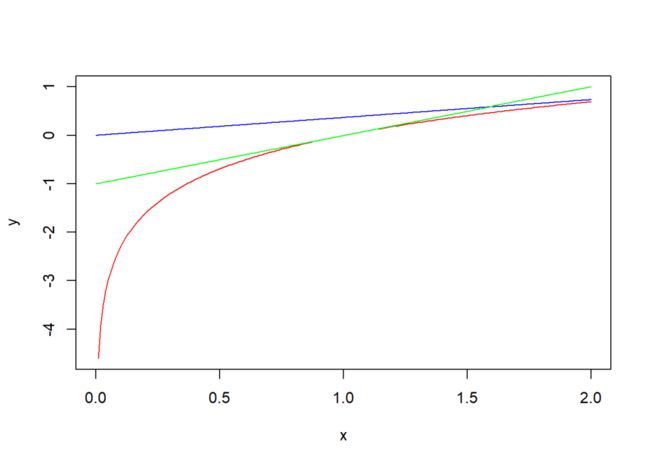
下列代码中,自变量x只有一个序列,而因变量y有多个序列:
x <- seq(0,2,0.01)
y <- data.frame(a = log(x), b = x*exp(-1),
                c = x - 1)

matplot(x, y, type = "l", pch = 1, lty = 1,
        col = c("red", "blue", "green"))
当参数x和y的位置只有一个取值时,该函数将其视为因变量y,而将x视为c(1:n)。
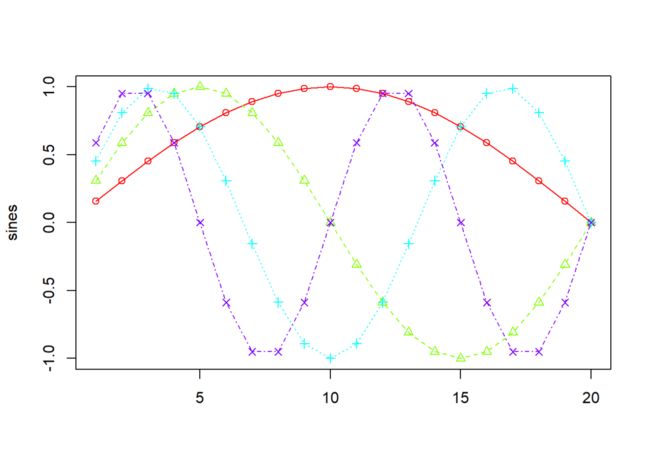
下列代码来自官方文档:
sines <- outer(1:20, 1:4, function(x, y) sin(x / 20 * pi * y))
head(sines)
##           [,1]      [,2]      [,3]          [,4]
## [1,] 0.1564345 0.3090170 0.4539905  5.877853e-01
## [2,] 0.3090170 0.5877853 0.8090170  9.510565e-01
## [3,] 0.4539905 0.8090170 0.9876883  9.510565e-01
## [4,] 0.5877853 0.9510565 0.9510565  5.877853e-01
## [5,] 0.7071068 1.0000000 0.7071068  1.224606e-16
## [6,] 0.8090170 0.9510565 0.3090170 -5.877853e-01

matplot(sines, pch = 1:4, type = "o", col = rainbow(ncol(sines)))
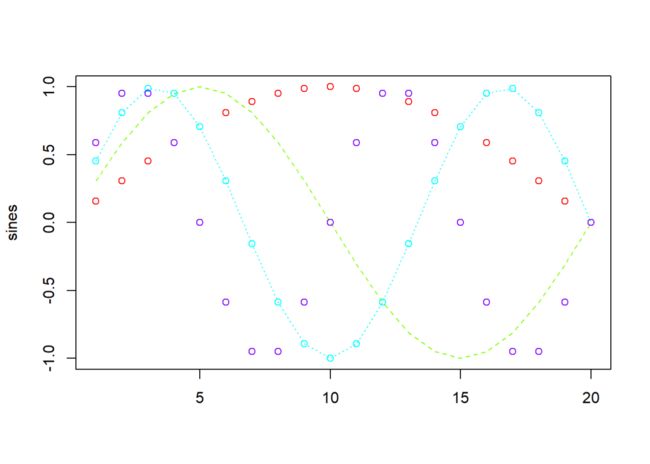
type参数与plot函数的同名参数功能一致。由于该函数用于多序列数据绘图,type参数可以设置成组合字符的形式,如下列代码中,type = "plo"表示type参数在p、l、o中进行循环赋值:
matplot(sines, pch = 1, type = "plo", col = rainbow(ncol(sines)))
matplot函数另外有两个快捷函数,分别相当于type参数取值为p和l的情况:
matpoints()matlines()
pairs()
该函数是plot.data.frame用法的进阶版:
pairs(x, labels, panel = points, ...,
      horInd = 1:nc, verInd = 1:nc,
      lower.panel = panel, upper.panel = panel,
      diag.panel = NULL, text.panel = textPanel,
      label.pos = 0.5 + has.diag/3, line.main = 3,
      cex.labels = NULL, font.labels = 1,
      row1attop = TRUE, gap = 1, log = "",
      horOdd = !row1attop, verOdd = !row1attop)
从mtcars中提取三个变量进行绘图:
data <- mtcars[, c("drat", "qsec", "wt")]
pairs(data, pch = 21,
      bg = c("red", "blue", "green"))
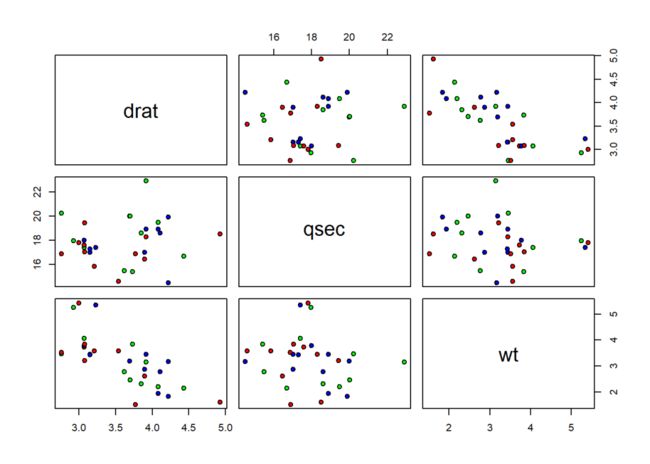
或者使用表达式的形式:
pairs(~ drat + qsec + wt, data = mtcars, pch = 21,
      bg = c("red", "blue", "green"))
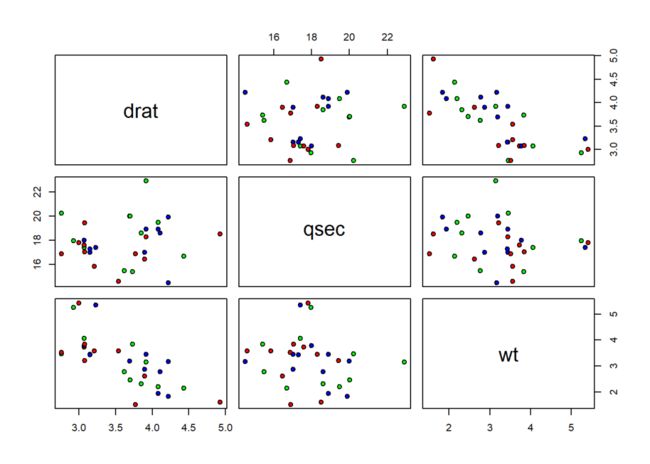
该函数有5个面板参数:
panel:全局面板参数;
lower.panel:下三角面板参数;
upper.panel:上三角面板参数;
diag.panel:对角面板参数;
text.panel:文本面板参数。
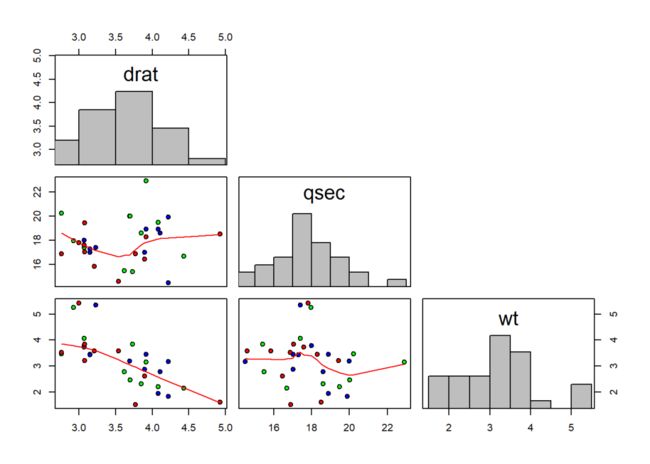
除text.panel外,其余4个面板参数分别控制对应位置的图形样式,取值为合适的绘图函数名,如points表示散点图,lines表示折线图,此外还有面板平滑函数:
panel.smooth(x, y, col = par("col"), bg = NA,
             pch = par("pch"), cex = 1,
             col.smooth = "red", span = 2/3,
             iter = 3, ...)
也可以使用自定义函数:
panel.hist <- function(x, ...) {
    usr <- par("usr"); on.exit(par(usr))
    par(usr = c(usr[1:2], 0, 1.5) )
    h <- hist(x, plot = FALSE)
    breaks <- h$breaks; nB <- length(breaks)
    y <- h$counts; y <- y/max(y)
    rect(breaks[-nB], 0, breaks[-1], y,
         col = "grey", ...) }
当面板参数取值为NULL时表示对应位置为空白。
示例如下:
pairs(data, pch = 21,
      panel = panel.smooth, # 全局使用平滑函数
      upper.panel = NULL, # 去除上三角
      diag.panel = panel.hist, # 对角绘制直方图
      bg = c("red", "blue", "green"))
coplot()
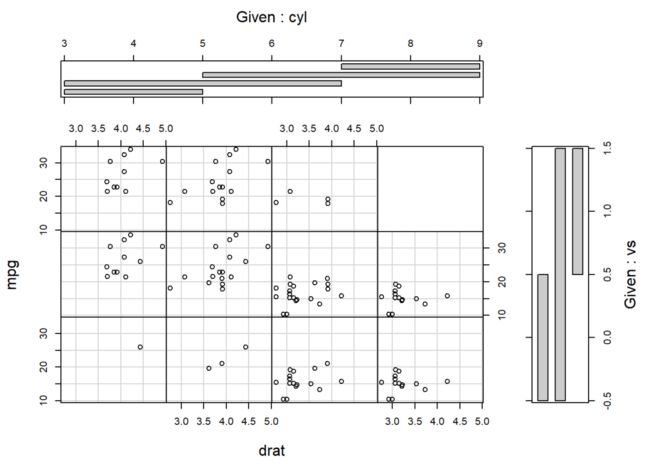
该函数绘制条件散点图(Conditioning Plots):
coplot(formula, data,
       given.values, panel = points,
       rows, columns,
       show.given = TRUE,
       col = par("fg"), pch = par("pch"),
       bar.bg = c(num = gray(0.8), fac = gray(0.95)),
       xlab = c(x.name, paste("Given :", a.name)),
       ylab = c(y.name, paste("Given :", b.name)),
       subscripts = FALSE,
       axlabels = function(f) abbreviate(levels(f)),
       number = 6, overlap = 0.5, xlim, ylim, ...)
下列代码绘制cyl变量(即条件变量Given)在不同取值下,变量drat与mpg之间的散点图:
coplot(mpg ~ drat | cyl, data = mtcars)
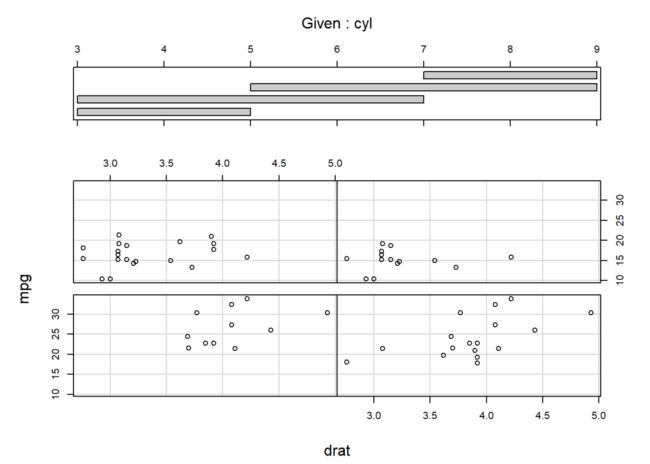
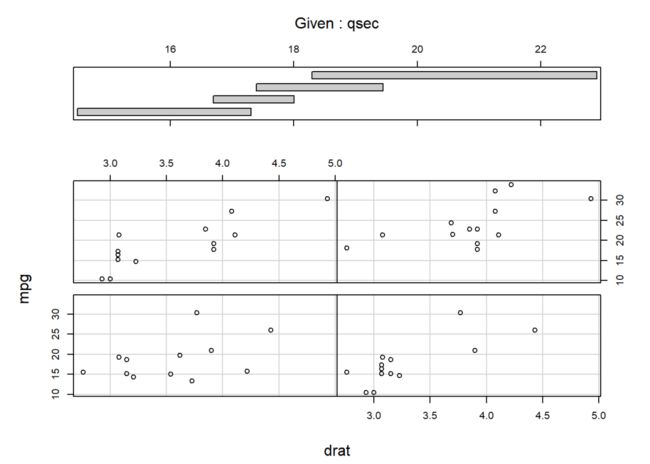
条件变量不需要是因子变量,
number参数控制将条件变量分成的组数,默认为6。
co.intervals函数可以对条件变量进行区间划分,并赋值给coplot函数的given.values参数。
co.intervals函数的语法结构:
co.intervals(x, number = 6, overlap = 0.5)
示例:
given.v <- co.intervals(mtcars$qsec, number = 4)
coplot(mpg ~ drat | qsec, data = mtcars,
       given.values = given.v)
条件变量有两个时,使用符号*:
coplot(mpg ~ drat | cyl*vs, data = mtcars)
