拓端tecdat:Python | ARIMA时间序列模型预测航空公司的乘客数量
原文链接:http://tecdat.cn/?p=20742
原文出处:拓端数据部落公众号
时间序列 被定义为一系列按时间顺序索引的数据点。时间顺序可以是每天,每月或每年。
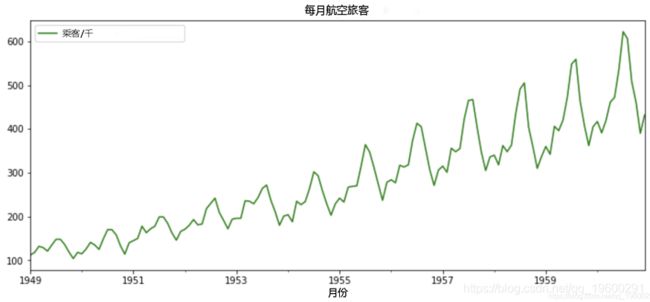
以下是一个时间序列示例,该示例说明了从1949年到1960年每月航空公司的乘客数量。
时间序列预测
时间序列预测是使用统计模型根据过去的结果预测时间序列的未来值的过程。
一些示例
- 预测未来的客户数量。
- 解释销售中的季节性模式。
- 检测异常事件并估计其影响的程度。
- 估计新推出的产品对已售出产品数量的影响。
时间序列的组成部分:
代码:航空公司乘客的ETS分解数据集:
# 导入所需的库

import numpy as np


# 读取AirPassengers数据集

airline = pd.read_csv('data.csv',

                       index_col ='Month',

                       parse_dates = True)


# 输出数据集的前五行

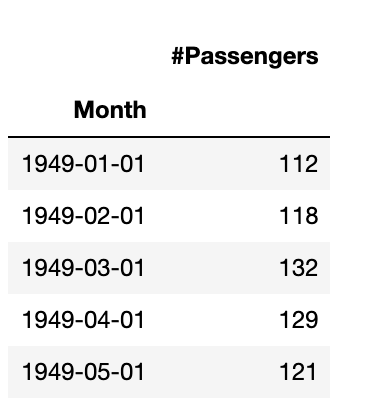
airline.head()


# ETS分解


# ETS图

result.plot()
输出:
ARIMA时间序列预测模型
ARIMA代表自回归移动平均模型,由三个阶数参数 (p,d,q)指定。
ARIMA模型的类型
自动ARIMA
“ auto_arima” 函数 可帮助我们确定ARIMA模型的最佳参数,并返回拟合的ARIMA模型。
代码:ARIMA模型的参数分析
# 忽略警告

import warnings

warnings.filterwarnings("ignore")


# 将自动arima函数拟合到AirPassengers数据集

autoarima(airline['# Passengers'], start_p = 1, start_q = 1,

                          max_p = 3, max_q = 3, m = 12,


                          stepwise = True          # 设置为逐步


# 输出摘要

stepwise_fit.summary()代码:将ARIMA模型拟合到AirPassengers数据集
# 将数据拆分为训练/测试集


test = iloc[len(airline)-12:] # 设置一年(12个月)进行测试


# 在训练集上拟合一个SARIMAX(0,1,1)x(2,1,1,12)


SARIMAX(Passengers,

                order = (0, 1, 1),

                seasonal_order =(2, 1, 1, 12


result.summary()代码:ARIMA模型对测试集的预测
# 针对测试集的一年预测

predict(start, end,


#绘图预测和实际值

predictions.plot
输出:
代码:使用MSE和RMSE评估模型
# 加载特定的评估工具
# 计算均方根误差

rmse(test["# Passengers"], predictions)


# 计算均方误差

mean_squared_error(test["# Passengers"], predictions)
输出:
代码:使用ARIMA模型进行预测
# 在完整数据集上训练模型


result = model.fit()


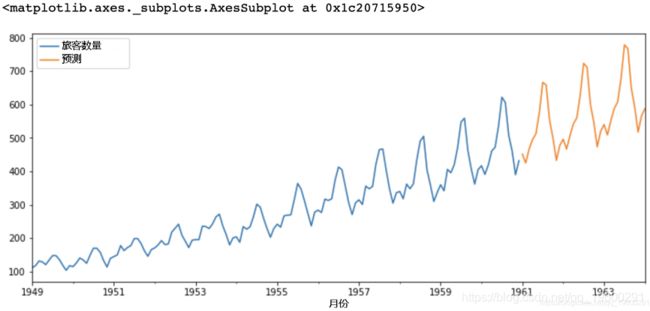
# 未来3年预测
result.predict(start = len(airline),

                          end = (len(airline)-1) + 3 * 12,


# 绘制预测值
forecast.plot(legend = True)
输出:
- 趋势:趋势显示了长时间序列数据的总体方向。趋势可以是增加(向上),减少(向下)或水平(平稳)。
- 季节性:季节性成分在时间,方向和幅度方面表现出重复的趋势。一些例子包括由于炎热的天气导致夏季用水量增加,或每年假期期间航空公司乘客人数增加。
- 周期性成分: 这些是在特定时间段内没有稳定重复的趋势。周期是指时间序列的起伏,通常在商业周期中观察到。这些周期没有季节性变化,但通常会在3到12年的时间范围内发生,具体取决于时间序列的性质。
- 不规则变化: 这些是时间序列数据中的波动,当趋势和周期性变化被删除时,这些波动变得明显。这些变化是不可预测的,不稳定的,并且可能是随机的,也可能不是随机的。
- ETS分解
ETS分解用于分解时间序列的不同部分。ETS一词代表误差、趋势和季节性。 - AR(p)自回归 –一种回归模型,利用当前观测值与上一个期间的观测值之间的依存关系。自回归(AR(p))分量是指在时间序列的回归方程中使用过去的值。
- I(d) –使用观测值的差分(从上一时间步长的观测值中减去观测值)使时间序列稳定。差分涉及将序列的当前值与其先前的值相减d次。
- MA(q)移动平均值 –一种模型,该模型使用观测值与应用于滞后观测值的移动平均值模型中的残留误差之间的相关性。移动平均成分将模型的误差描述为先前误差项的组合。 q 表示要包含在模型中的项数。
- ARIMA:非季节性自回归移动平均模型
- SARIMA:季节性ARIMA
- SARIMAX:具有外生变量的季节性ARIMA
最受欢迎的见解
1.在python中使用lstm和pytorch进行时间序列预测
2.python中利用长短期记忆模型lstm进行时间序列预测分析
3.使用r语言进行时间序列(arima,指数平滑)分析
4.r语言多元copula-garch-模型时间序列预测
5.r语言copulas和金融时间序列案例
6.使用r语言随机波动模型sv处理时间序列中的随机波动
7.r语言时间序列tar阈值自回归模型
8.r语言k-shape时间序列聚类方法对股票价格时间序列聚类
9.python3用arima模型进行时间序列预测


