机器学习(三)——多项式回归
引言
我们创建一组数据,并绘出散点图。
x = np.random.uniform(-3, 3, size=100)
print(x.shape)
y = 0.5 + x**2 + x + 2 + np.random.normal(0, 1, size=100)
plt.scatter(x, y)
plt.show()
from sklearn.linear_model import LinearRegression

lin_reg = LinearRegression()
lin_reg.fit(X, y)
y_predict = lin_reg.predict(X)
plt.scatter(x, y)
plt.plot(x, y_predict, color='r')
plt.show()
多项式回归
我们试着添加一个特征,即 x的二次项,再进行线性回归。
X2 = np.hstack([X, X**2])
lin_reg2 = LinearRegression()
lin_reg2.fit(X2, y)
y_predict2 = lin_reg2.predict(X2)
plt.scatter(x, y)
plt.plot(np.sort(x), y_predict2[np.argsort(x)], color='r')
plt.show()

可以明显看出,拟合效果大大提高了,这就是多项式回归,利用特征的高次项,可以用来拟合非线性曲线。
sklearn包完成多项式回归
我们可以通过 sklearn 包中的 PolynomialFeatures 构建高维特征。
import numpy as np

x = np.arange(1, 11).reshape(5, 2)
x.shape
# (5, 2)
x
将其升为二阶
from sklearn.preprocessing import PolynomialFeatures

poly = PolynomialFeatures()
poly.fit(x)
x2 = poly.transform(x)
x2.shape
# (5, 6)
x2
array([[  1.,   1.,   2.,   1.,   2.,   4.],
       [  1.,   3.,   4.,   9.,  12.,  16.],
       [  1.,   5.,   6.,  25.,  30.,  36.],
       [  1.,   7.,   8.,  49.,  56.,  64.],
       [  1.,   9.,  10.,  81.,  90., 100.]])
其中第1项为常数项,第2第3项为一次项x1,x2,第4第6项为二次项x12,x22,第5项为x1x2。
我们再将其升为三阶看看。
poly = PolynomialFeatures(degree=3)
poly.fit(x)
x3 = poly.transform(x)
x3.shape
# (5, 10)
array([[   1.,    1.,    2.,    1.,    2.,    4.,    1.,    2.,    4.,
           8.],
       [   1.,    3.,    4.,    9.,   12.,   16.,   27.,   36.,   48.,
          64.],
       [   1.,    5.,    6.,   25.,   30.,   36.,  125.,  150.,  180.,
         216.],
       [   1.,    7.,    8.,   49.,   56.,   64.,  343.,  392.,  448.,
         512.],
       [   1.,    9.,   10.,   81.,   90.,  100.,  729.,  810.,  900.,
        1000.]])
这十项分别对应如下:

sklearn 包没有对多项式回归进行封装,不过可以使用 Pipeline 对数据归一化、多项式生维、线性回归进行整合。代码如下:
import numpy as np
import matplotlib.pyplot as plt

x = np.random.uniform(-3, 3, size=100)
X = x.reshape(-1, 1)
y = 0.5 * x**2 + 2 + np.random.normal(0, 1, size=100)

from sklearn.pipeline import Pipeline
from sklearn.preprocessing import PolynomialFeatures
from sklearn.linear_model import LinearRegression
from sklearn.preprocessing import StandardScaler

poly_reg = Pipeline([
    ('poly', PolynomialFeatures(degree=2)),
    ('std_scale', StandardScaler()),
    ('lin_reg', LinearRegression())
])
poly_reg.fit(X, y)
y_predict = poly_reg.predict(X)

plt.scatter(x, y)
plt.plot(np.sort(x), y_predict[np.argsort(x)], color='r')
plt.show()
过拟合
我们可以看到,高维可以有效地拟合训练集,但有没有危害呢?我们来看看下面的情况。
我们将数据集分为训练集与测试集,分别训练一维,二维,十维,一百维。观察其在测试集上的均方误差。
一维
from sklearn.model_selection import train_test_split
import numpy as np
import matplotlib.pyplot as plt

np.random.seed(666)
np.random.seed(666)
x = np.random.uniform(-3.0, 3.0, size=100)
X = x.reshape(-1, 1)
y = 0.5 * x**2 + x + 2 + np.random.normal(0, 1, size=100)

x_train, x_test, y_train, y_test = train_test_split(X, y, random_state=666)
lin_reg = LinearRegression()
lin_reg.fit(x_train, y_train)
y_predict = lin_reg.predict(x_test)
mean_squared_error(y_test, y_predict)
输出结果:2.2199965269396573
二维
from sklearn.pipeline import Pipeline
from sklearn.preprocessing import PolynomialFeatures
from sklearn.linear_model import LinearRegression
from sklearn.preprocessing import StandardScaler

def PolynomialRegression(degree):
    return Pipeline([
        ('poly', PolynomialFeatures(degree=degree)),
        ('std_scale', StandardScaler()),
        ('lin_reg', LinearRegression())
    ])
poly2_reg = PolynomialRegression(degree=2)
poly2_reg.fit(x_train, y_train)
y2_predict = poly2_reg.predict(x_test)
mean_squared_error(y_test, y2_predict)
输出结果: 0.8035641056297901
十维
poly10_reg = PolynomialRegression(degree=10)
poly10_reg.fit(x_train, y_train)
y10_predict = poly10_reg.predict(x_test)
mean_squared_error(y_test, y10_predict)
输出结果:0.9212930722150781
我们看到二维的误差比一维小了很多,但是十维的测试误差又变大了。
百维
poly100_reg = PolynomialRegression(degree=100)
poly100_reg.fit(x_train, y_train)
y100_predict = poly100_reg.predict(x_test)
mean_squared_error(y_test, y100_predict)
输出结果:14440175276.314638,逐渐离谱了起来。
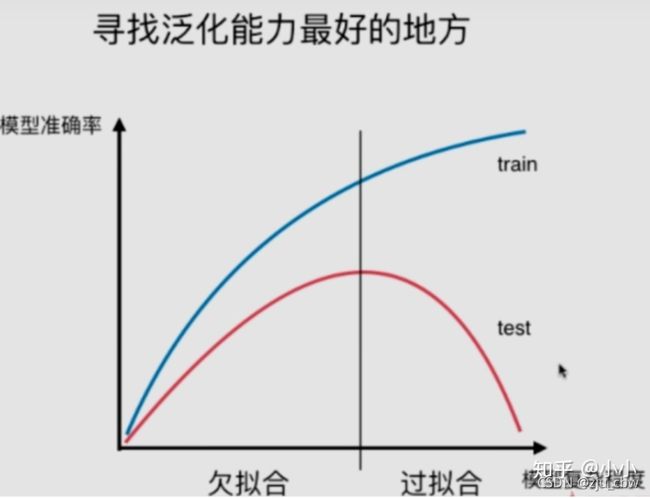
这就是产生了过拟合的问题,即训练集表现很好,但测试集表现特别差,泛化能力很差。

模型太简单会欠拟合,模型太复杂又会产生过拟合。那么如何辨别当前模型是欠拟合还是过拟合呢?最好的方式就是通过学习曲线判别。
学习曲线
封装一个学习曲线的函数
def plot_learning_curve(algo, x_train, x_test, y_train, y_test):

    train_score = []
    test_score = []
    for i in range(1, len(x_train)+1):
        algo.fit(x_train[:i], y_train[:i])

        y_train_predict = algo.predict(x_train[:i])
        train_score.append(mean_squared_error(y_train[:i], y_train_predict))

        y_test_predict = algo.predict(x_test)
        test_score.append(mean_squared_error(y_test, y_test_predict))

    plt.plot([i for i in range(1, len(x_train)+1)], np.sqrt(train_score), label='train')
    plt.plot([i for i in range(1, len(x_train)+1)], np.sqrt(test_score), label='test')
    plt.legend()
    # plt.axis([0, len(x_train)+1, 0, 4])
    plt.show()
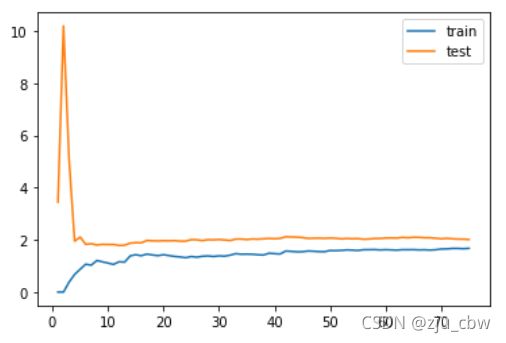
绘制一维的学习曲线
plot_learning_curve(LinearRegression(), x_train, x_test, y_train, y_test)

可以看出训练误差和测试误差都很大,这就是发生了欠拟合。
绘制二维的学习曲线。
from sklearn.pipeline import Pipeline
from sklearn.preprocessing import PolynomialFeatures
from sklearn.linear_model import LinearRegression
from sklearn.preprocessing import StandardScaler

def PolynomialRegression(degree):
    return Pipeline([
        ('poly', PolynomialFeatures(degree=degree)),
        ('std_scale', StandardScaler()),
        ('lin_reg', LinearRegression())
    ])
poly2_reg = PolynomialRegression(degree=2)
plot_learning_curve(poly2_reg, x_train, x_test, y_train, y_test)

训练误差测试误差都很低,这就是最佳状态。
绘制二十维学习曲线。
poly2_reg = PolynomialRegression(degree=20)
plot_learning_curve(poly2_reg, x_train, x_test, y_train, y_test)


