关于ggplot2画散点图、条形图的一些细节认识
学习了ggplot2 的一些最基本的东西,有了一些细微的发现。对于画图来说,要引起注意。
1.散点图。点的颜色和形状的控制,放置的位置有讲究。如放置aes()里面,还是geom_point()里面大不相同。
library("ggplot2")
mtcars$am1<-factor(mtcars$am,levels = c(0,1),labels = c("自动","手动"))
mtcars$vs1<-factor(mtcars$vs,levels=c(0,1),labels=c("V型","普通"))
mtcars$cyl<-factor(mtcars$cyl)
str(mtcars)
'data.frame': 32 obs. of 13 variables:
$ mpg : num 21 21 22.8 21.4 18.7 18.1 14.3 24.4 22.8 19.2 ...
$ cyl : Factor w/ 3 levels "4","6","8": 2 2 1 2 3 2 3 1 1 2 ...
$ disp: num 160 160 108 258 360 ...
$ hp : num 110 110 93 110 175 105 245 62 95 123 ...
$ drat: num 3.9 3.9 3.85 3.08 3.15 2.76 3.21 3.69 3.92 3.92 ...
$ wt : num 2.62 2.88 2.32 3.21 3.44 ...
$ qsec: num 16.5 17 18.6 19.4 17 ...
$ vs : num 0 0 1 1 0 1 0 1 1 1 ...
$ am : num 1 1 1 0 0 0 0 0 0 0 ...
$ gear: num 4 4 4 3 3 3 3 4 4 4 ...
$ carb: num 4 4 1 1 2 1 4 2 2 4 ...
$ am1 : Factor w/ 2 levels "自动","手动": 2 2 2 1 1 1 1 1 1 1 ...
$ vs1 : Factor w/ 2 levels "V型","普通": 1 1 2 2 1 2 1 2 2 2 ...
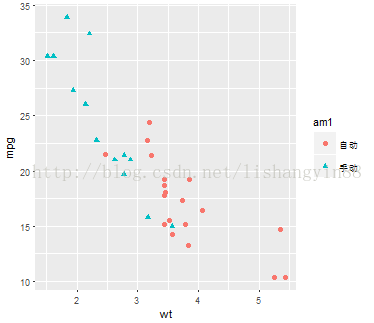
ggplot(mtcars,aes(x=wt,y=mpg,col=am1,shape=am1))+geom_point(size=2)
而:ggplot(mtcars,aes(x=wt,y=mpg))+geom_point(col=mtcars$am1,shape=mtcars$am1)结果会是什么呢?
结果:Error in grDevices::col2rgb(colour, TRUE) : '手动'颜色名字不对。
如果是:ggplot(mtcars,aes(x=wt,y=mpg))+geom_point(col=mtcars$cyl,shape=mtcars$cyl)结果会是什么呢?
还是错误么?
可以发现,图像出来了,但是里面并没有图例。想想为什么(mtcars$am1没有图像,而mtcars$cyl 确出来了)
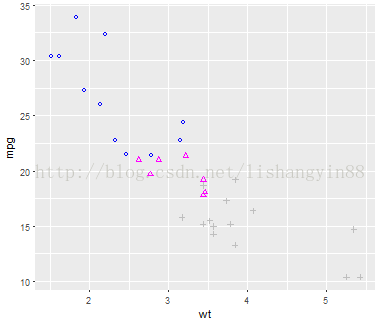
如果换成:ggplot(mtcars,aes(x=wt,y=mpg,col=mtcars$cyl,shape=mtcars$cyl))+geom_point()
此图与上图相比,图例出来了,形状和上图并不相同。因此如果是按照不同的面板或类别来区分的话,点和形状的控制就要放到aes()里面。
而且数值型的必须转换成factor类型#factor(data,levels=c(0,1,2,3),labels=c("a","b","c","d")),用以区分类别。
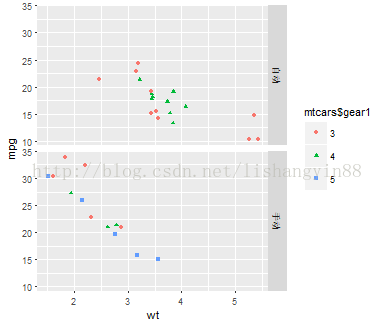
如果是分面板:
> ggplot(mtcars,aes(x=wt,y=mpg,col=mtcars$gear1,shape=mtcars$gear1))+geom_point()+facet_grid(mtcars$am1~.)
注意~. 表示的意义,漏掉"."会报错。
2.直方图
ggplot(mtcars,aes(x=gear,fill=am1))+geom_bar()
默认是叠加的,如果改为类别非叠加的则,ggplot(mtcars,aes(x=gear,fill=am1))+geom_bar(position = "dodge"),见下图。
ggplot(mtcars,aes(x=gear,fill=am1))+geom_bar(position = "fill")
由此可见:position 对于条形图来说,具有“生杀大权”。
#dodge 是躲避回避的意思。


