tensorflow tf.keras.layers tf.image 图像增强
import matplotlib.pyplot as plt
import numpy as np
import tensorflow as tf
import tensorflow_datasets as tfds

from tensorflow.keras import layers
from PIL import Image
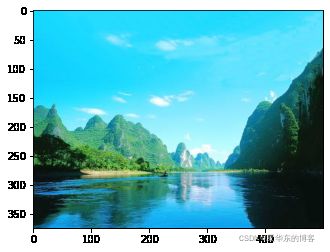
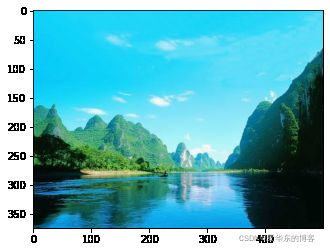
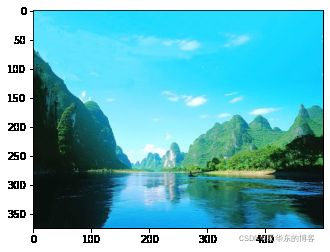
img = Image.open(r"C:\Users\xiahuadong\Pictures\风景\3.jpg")
arr_img = np.array(img)  # 图像转numpy数组
arr_img.shape
(375, 500, 3)
plt.imshow(arr_img)
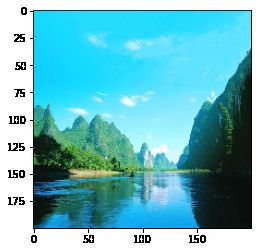
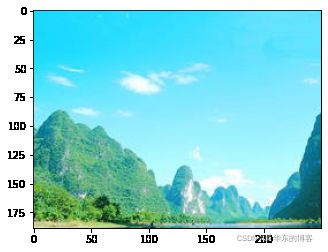
result = tf.image.resize(  # 调整图像大小
    arr_img,  # 图片numpy数组
    [200, 200],  # 图片大小
    method='nearest'  # 调整方法
)
print(result.shape)
plt.imshow(result)
(200, 200, 3)
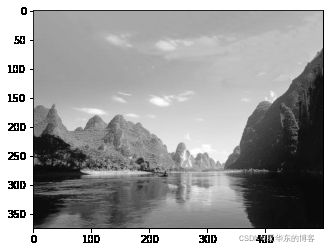
result = tf.image.rgb_to_grayscale(  # 将一个或多个图像从 RGB 转换为灰度
    arr_img  # 图片numpy数组
)
plt.imshow(
    result,
    cmap="gray"  # 灰度显示
)
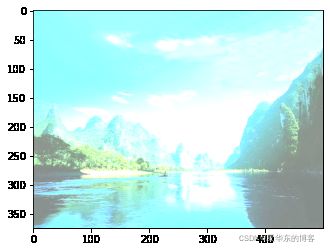
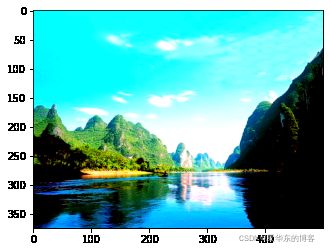
result = tf.image.adjust_brightness(  # 调整 RGB 或灰度图像的亮度。
    arr_img,  # 图片numpy数组
    delta=0.5  # 标量。要添加到像素值中的数值。
)
plt.imshow(result)
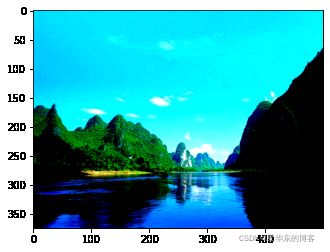
result = tf.image.adjust_contrast(  # 调整 RGB 或灰度图像的对比度
    arr_img,  # 图片numpy数组
    2.  # 用于调整对比度的浮点乘数。
)
plt.imshow(result)
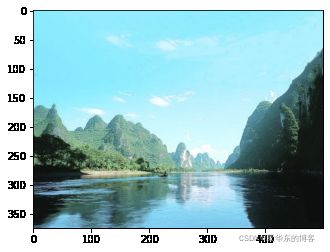
result = tf.image.adjust_saturation(  # 调整 RGB 图像的饱和度
    arr_img,  # RGB 图像或图像。最后一个维度的大小必须为 3。
    0.5  # 浮点数,将饱和度乘以的因子。
)
plt.imshow(result)
result = tf.image.random_brightness(  # 通过随机系数调整图像的亮度。
    arr_img,  # 要调整的一个或多个图像。
    0.2  # 浮点数,必须是非负数。
)
plt.imshow(result)
result = tf.image.per_image_standardization(  # 线性缩放每个图像,使均值为 0,方差为 1
    arr_img,  # 具有至少 3 个维度的 n-D,其中最后 3 个是每个图像的维度
)
plt.imshow(result)
Clipping input data to the valid range for imshow with RGB data ([0..1] for floats or [0..255] for integers).
result = tf.image.central_crop(  # 移除图像的外部,但沿每个维度保留图像的中心区域。
    arr_img,  # 3-D 浮点张量或形状
    0.5  # 裁剪大小分数
)
plt.imshow(result)
result = tf.image.flip_left_right(  # 水平翻转图像(从左到右)
    arr_img, )
plt.imshow(result)
data_augmentation = tf.keras.Sequential([
  layers.RandomFlip("horizontal_and_vertical"),
  layers.RandomRotation(0.2),
])
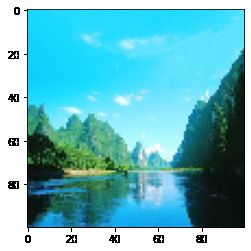
resize_and_rescale = tf.keras.Sequential([
  layers.Resizing(100, 100), # 使用 Keras 预处理图层将图像大小调整为一致的形状
  layers.Rescaling(1./255) # 重新缩放像素值
])
result = resize_and_rescale(arr_img)
plt.imshow(result)
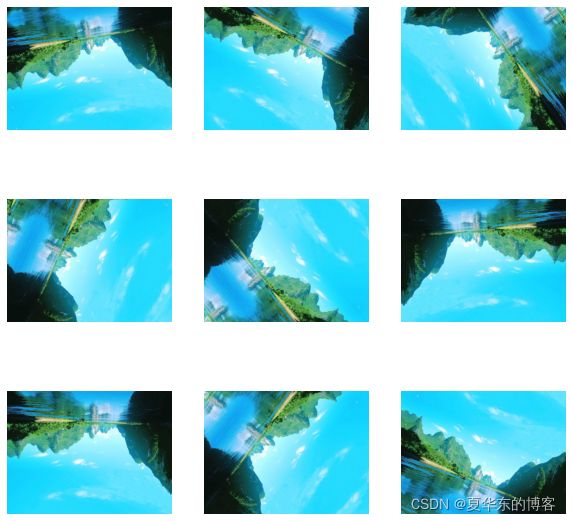
data_augmentation = tf.keras.Sequential([
    layers.RandomFlip("horizontal_and_vertical"),  # 旋转图片
    layers.RandomRotation(0.2),  # 旋转幅度
])
# 添加图片维度
image = tf.expand_dims(arr_img, 0)
plt.figure(figsize=(10, 10))
for i in range(9):
    augmented_image = data_augmentation(image)
    print(augmented_image.shape)
    ax = plt.subplot(3, 3, i + 1)
    plt.imshow(augmented_image[0])
    plt.axis("off")
(1, 375, 500, 3)
(1, 375, 500, 3)
(1, 375, 500, 3)
(1, 375, 500, 3)
(1, 375, 500, 3)
(1, 375, 500, 3)
(1, 375, 500, 3)
(1, 375, 500, 3)
(1, 375, 500, 3)
