《Web安全之机器学习入门》笔记:第八章 8.2 逻辑回归hello world
这一小节主要内容是用鸢尾花数据集来作为实验数据集讲解逻辑回归的基本用法
1. 源码修改
书中配套源码为8-1.py,源码报警
C:\ProgramData\Anaconda3\python.exe C:/Users/liujiannan/PycharmProjects/pythonProject/Web安全之机器学习入门/code/8-1.py
None
C:\ProgramData\Anaconda3\lib\site-packages\sklearn\linear_model\logistic.py:432: FutureWarning: Default solver will be changed to 'lbfgs' in 0.22. Specify a solver to silence this warning.
  FutureWarning)
C:\ProgramData\Anaconda3\lib\site-packages\sklearn\linear_model\logistic.py:469: FutureWarning: Default multi_class will be changed to 'auto' in 0.22. Specify the multi_class option to silence this warning.
  "this warning.", FutureWarning)

Process finished with exit code 0
(1)对于 如下报警信息1的处理
FutureWarning: Default solver will be changed to 'lbfgs' in 0.22. Specify a solver to silence this warning.原因:LogisticRegerssion算法的solver仅支持以下几个参数’liblinear’, ‘newton-cg’, ‘lbfgs’, ‘sag’, ‘saga’。
如果数据集比较小,则 ‘liblinear’是很好的选择; 如果数据集很大,用‘sag’ and ‘saga’;
如果是多分类任务,则用 ‘newton-cg’, ‘sag’, ‘saga’ and ‘lbfgs’ ; ‘liblinear’ 只能用于二分类问题。
‘newton-cg’, ‘lbfgs’ and ‘sag’只处理 L2 范式的正则项,而 ‘liblinear’ and ‘saga’ 只处理 L1范式的正则项.
修改方法
logreg = linear_model.LogisticRegression(C=1e5,solver='liblinear')
(2)对于报警信息2的处理
Future Warning: Default multi_class will be changed to 'auto' in 0.22. Specify the multi_class option to silence this warning.这个警告信息仅仅影响了对多类分类问题使用Logit模型分类,而不是该方法设计的二进制分类问题。多类参数的默认值从‘ovr’改为‘auto’。修改后源码如下
logreg = linear_model.LogisticRegression(C=1e5,solver='lbfgs', multi_class='ovr')2.完整源码
使用iris数据集进行分类,代码如下
print(__doc__)


import numpy as np
import matplotlib.pyplot as plt
from sklearn import linear_model, datasets


iris = datasets.load_iris()
X = iris.data[:, :2]
Y = iris.target

h = .02

logreg = linear_model.LogisticRegression(C=1e5,solver='lbfgs', multi_class='ovr')
logreg.fit(X, Y)


x_min, x_max = X[:, 0].min() - .5, X[:, 0].max() + .5
y_min, y_max = X[:, 1].min() - .5, X[:, 1].max() + .5
xx, yy = np.meshgrid(np.arange(x_min, x_max, h), np.arange(y_min, y_max, h))
Z = logreg.predict(np.c_[xx.ravel(), yy.ravel()])


Z = Z.reshape(xx.shape)
plt.figure(1, figsize=(4, 3))
plt.pcolormesh(xx, yy, Z, cmap=plt.cm.Paired)


plt.scatter(X[:, 0], X[:, 1], c=Y, edgecolors='k', cmap=plt.cm.Paired)
plt.xlabel('Sepal length')
plt.ylabel('Sepal width')

plt.xlim(xx.min(), xx.max())
plt.ylim(yy.min(), yy.max())
plt.xticks(())
plt.yticks(())

plt.show()
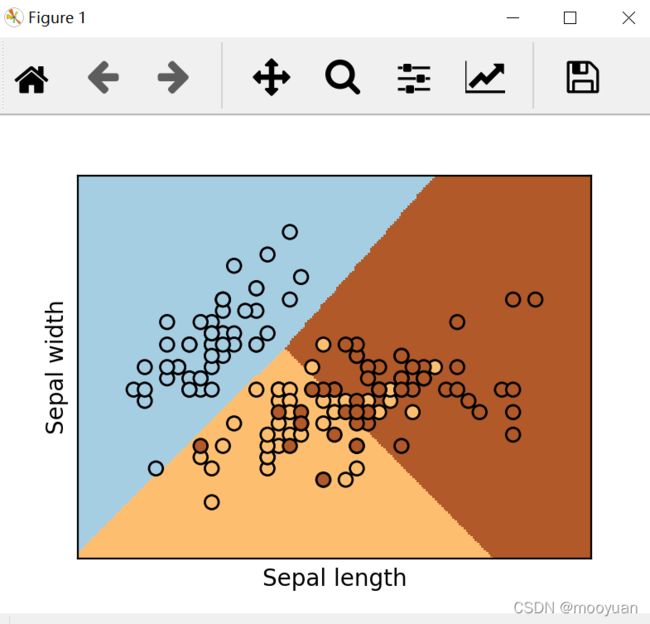
3.运行结果如下所示
