- node.js使用commander包构建命令行应用
crayon-shin-chan
surprisenode.jstypescriptjavascriptnodejs
仓库:https://github.com/tj/commander.js1.简介commander是node.js命令行接口的完整解决方案。2.安装npminstallcommander3.开始使用Commander导出一个全局对象,这对于快速程序很方便。为了简洁起见,在本自述文件的示例中使用了此方法。const{program}=require('commander');program.ver
- 在 Python 中,`typing` 模块提供了类型提示(Type Hints)的功能,可以用来标记变量、函数参数和返回值等的类型,Any, Dict, List, Literal, Optiona
愚昧之山绝望之谷开悟之坡
笔记pythonpython开发语言
在Python中,typing模块提供了类型提示(TypeHints)的功能,可以用来标记变量、函数参数和返回值等的类型。下面是typing模块中几个常用的类型的详细解释和举例。Any类型表示一个可以是任何类型的值,它可以作为变量的类型、函数的参数类型或返回类型等。这个类型通常用于那些无需考虑类型约束,或是需要通过检查变量类型来进行调试的代码中。以下是一个使用Any类型的例子:fromtyping
- Java 中如何使用 SSL 连接 IoTDB
铁头乔
javassliotdb数据库时序数据库开源
问题Java中如何使用SSL连接IoTDB?方案SSL(SecureSocketsLayer)是一种安全协议,用于在网络通信中提供加密、认证和数据完整性保护。它主要用于在互联网上保护数据传输,确保数据在传输过程中不被窃听或篡改。IoTDB支持SSL协议,但是在配置文件中相关参数是默认关闭的状态,如下:#Doesdn_rpc_portenableSSL#effectiveMode:restart#D
- Java stream流的避坑指南
冰糖心158
2025Java面试系列java
在使用JavaStreamAPI时,虽然它提供了强大的功能来简化集合操作,但也存在一些常见的“坑”需要注意。以下是详细的避坑指南:1.Stream的不可重用性问题:Stream一旦被消费(如调用forEach、collect等终端操作),就不能再次使用。解决方案:如果需要多次操作同一个数据源,可以重新创建Stream,或者将Stream的结果保存到集合中。Listnumbers=Arrays.as
- ESP32-S3模组上跑通esp32-camera(30)
蓝天居士
ESP32-S3ESP32-S3camerasensorOV5640
接前一篇文章:ESP32-S3模组上跑通esp32-camera(29)一、OV5640初始化2.相机初始化及图像传感器配置上一回解析完了camera_probe函数的第6段代码,本回继续往下解析该函数后续内容。为了便于理解和回顾,再次贴出camera_probe函数源码,在components/esp32-camera/driver/esp_camera.c中,如下:staticesp_err_
- 简单的基于Spring Cloud和Vue的示例项目结构及部分关键代码
软件职业规划
springspringcloudvue.jsspring
后端(SpringCloud部分)1.创建SpringCloud项目(以SpringCloudGateway和SpringCloudEureka为例)首先,使用SpringInitializr创建一个基础的SpringBoot项目,并添加相关的SpringCloud依赖,比如:spring-cloud-starter-gateway:用于实现API网关功能。spring-cloud-starter
- 图像处理算法研究的程序框架
mickey0380
系统调用图像处理算法程序框架Windows
目录1程序框架简介2C#图像读取、显示、保存模块3C动态库图像算法模块4C#调用C动态库5演示Demo5.1开发环境5.2功能介绍5.3下载地址参考1程序框架简介一个图像处理算法研究的常用程序逻辑框架,如下图所示在该框架中,将图像处理算法产品分为上层模块和底层模块两个部分。底层模块使用C/C++实现算法API,提供给上层模块调用;上层模块执行调用API和一些界面功能的实现,最后得到不同平台的软件产
- 从零基础开始实现一个Spring Boot + Vue 项目的详细步骤指南
软件职业规划
springspringbootvue.js后端
一、准备工作1.开发环境搭建安装JDK(JavaDevelopmentKit):前往Oracle官网(https://www.oracle.com/java/technologies/javase-jdk11-downloads.html,以JDK11为例)下载适合你操作系统的JDK安装包,按照安装向导完成安装。安装完成后,配置系统环境变量,确保在命令行中能通过java-version命令查看到正
- fastapi 请求体 成员变量不被识别
m0_75101866
pythonfastapi
问题写了一个pydantic模型:classrequestPostBody(BaseModel):name1:strname2:str_name3:dict访问/docs时,不显示_name3的参数,在请求体添加_name3也出错raiseAttributeError(f'{type(self).__name__!r}objecthasnoattribute{item!r}')fromexcAtt
- 图像处理之颜色空间小结
AI洲抿嘴的薯片
opencv算法专题图像处理人工智能
1.介绍在图像处理中,我们会遇到各式各样的颜色空间,比如RGB、HLS、HSV、HSB、YCrCb、CIEXYZ、CIELab,那么它们的区别和应用场所又在哪里呢?1)RGB是生活中最常见的颜色空间,其中,R代表红色通道,G代表绿色通道,B代表蓝色通道,它们之间的相互搭配组合256*256*256,几乎可以包括人类视力所能感知的所有颜色。应用场所:一般的彩色图片都是用RGB三通道来表示,另外,在深
- 深入解析华为OD机试:开放日活动“取出尽量少的球”题解及C++、Java、JavaScript、Python详细实现
m0_57781768
华为odc++java
深入解析华为OD机试:开放日活动“取出尽量少的球”题解及C++、Java、JavaScript、Python详细实现在华为OD机试的算法考题中,字符串处理、动态规划、二分查找等算法问题都频繁出现。这不仅是为了考查面试者的算法基础,还要求能够通过高效的逻辑思维解决问题。今天我们将深度分析一道关于“取出尽量少的球”的题目,并通过C++、Java、JavaScript、Python四种编程语言详细解析和
- 注解Annontation 详解
宸之元亨利贞
JavaSE基础javalombokjunitspringintegration
什么是注解Annontation?Annontation是Java5开始引入的新特征,中文名称叫注解。它提供了一种安全的类似注释的机制,用来将任何的信息或元数据(metadata)与程序元素(类、方法、成员变量等)进行关联。为程序的元素(类、方法、成员变量)加上更直观更明了的说明,这些说明信息是与程序的业务逻辑无关,并且供指定的工具或框架使用。Annontation像一种修饰符一样,应用于包、类型
- 【MQ】RabbitMq的可靠性保证
lose_rose777
面试题java中间件网络
消息队列中的可靠性主要是分为三部分:消息不丢失:确保消息从生产者发送到消费者消息不丢失消息不重复:确保消息不被重复消费消息顺序性:确保消费的顺序性解决方案主要有以下几部分:消息不丢失生产者确认机制持久化机制消费者确认机制高可用消息不重复:消费者确认机制消息重试机制幂等性设计消息顺序性单消费者模式消息编号生产者确认机制作用确保生产者发送的消息成功到达mq,避免消息在传输过程中丢失实现原理生产者会发送
- spring security解析----架构解读
梦醉天下
编程安全springsecurity
之前写了一个关于session的,看到大家现在用springsecurity还挺多,相比当时我开始用的时候,大家都在shiro。就写几篇关于springsecurity实践以后的总结吧。先从整体的springsecurity架构设计谈谈。(后面很多内容都是借用官网最新文档)springsecurity是spring框架下的安全解决方案,从刚开始到现在,已经经历了很多版本,但是总的架构设计没有变化。
- 策略模式-简单工具包
冥王 • 雷利
技术经验设计模式策略模式策略
策略是大家开发中用的很多模式,特别在解决相同流程多场景的模式下显得尤为的重要,其标准的结构就是一个加载多钟场景的上下文context,一个标准的处理接口handler及若干个根据不同场景的实现。举一个实际中碰到的场景,我要获取用户登录态中的登录信息,因为种种原因,需要根据不同的登录端,从不同环境或是请求域中获取登录态信息,例如APP端,H5,PC,那么根据不同端获取登录态信息就可以通过策略模式实现
- Java开发高频英语单词800+,熟悉后英文障碍又少了
万小猿En
程序员英语学习指北javajava英语英文单词语法
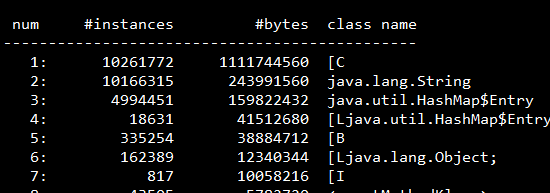
高频词就是出现频率很高的单词,它们是我用软件从JavaAPI中常用的5个包(lang,util,io,net,sql)整理的,涉及的文档有1702个。单词的意思大多不是通用的,已经选取了计算机软件开发语境下的含义。你可能也发现了,翻译过来的JavaAPI文档有些表述不好理解或信息有损耗,所以不如直接看英文版JavaAPI文档,而这些高频词可以帮到你。学习建议:熟悉的快速过,不熟悉的多记一下。序号频
- spring security配置详解
anzai561156
java
1.IS_AUTHENTICATED_ANONYMOUSLY表示的是匿名用户也可以访问。转载于:https://www.cnblogs.com/Aaronqcd/p/4848517.html
- Java 入门指南:集合概述
ZachOn1y
Javajava开发语言后端eclipsejava-ee
Java集合概述Java集合(Collections)是Java中提供的一种容器,用于存储和管理多个对象。与数组不同,集合的长度是可变的,且只能存储对象(包括对象的引用),不能存储基本数据类型。集合是Java编程中非常重要的一部分,特别是在处理大量数据时,集合提供了丰富的操作方法和灵活的数据结构。Java集合的体系结构Java集合,也叫作容器,主要是由两大接口派生而来:一个是Collection接
- Direct Preference Optimization (DPO): 一种无需强化学习的语言模型偏好优化方法
Yuleave
论文学习语言模型人工智能自然语言处理
论文地址:https://arxiv.org/pdf/2305.182901.背景与挑战近年来,大规模无监督语言模型(LM)在知识获取和推理能力方面取得了显著进展,但如何精确控制其行为仍是一个难题。现有的方法通常通过**强化学习从人类反馈(RLHF)**来引导模型行为,但RLHF存在以下问题:复杂性高:RLHF需要先训练一个奖励模型来反映人类偏好,然后使用强化学习来微调语言模型,使其在最大化奖励的
- 基于ARM的智能灯光控制系统(1)项目介绍
国产化创客
嵌入式项目Linux应用Linux驱动armhtmlc语言linux驱动网络编程
基于ARM的智能灯光控制系统(1)项目介绍项目实践说明:本实践项目是嵌入式开发培训(阶段2)底层系统开发视频课程的综合实践项目。项目开发使用的技术知识点包括:C语言编程,文件编程,串口编程,网络编程,多线程编程,进程间通信,嵌入式交叉开发,嵌入式Web服务器开发,HTML编程,Linux驱动程序开发。嵌入式开发培训(阶段2)底层系统开发视频地址智能灯光控制系统视频地址系统功能智能灯光系统是对灯光进
- 物联网网关Web服务器--CGI开发接口
国产化创客
物联网Web服务器嵌入式项目服务器物联网web网关
1、CGI(公用网关接口)CGI(公用网关接口)规定了Web服务器调用其他可执行程序(CGI程序)的接口协议标准。Web服务器通过调用CGI程序实现和Web浏览器的交互,也就是CGI程序接受Web浏览器发送给Web服务器的信息,进行处理,将响应结果再回送给Web服务器及Web浏览器。CGI程序一般完成Web网页中表单(Form)数据的处理、数据库查询和实现与传统应用系统的集成等工作。CGI程序可以
- JS在HTML页面内动态创建SVG元素
一粒马豆
html5JavaScript数据可视化SVGJSD3WEB
最近在学习数据可视化,深入了解了如何在网页上实现数据的动态可视化。比如D3.JS主要应用JS在HTML页面内动态生成SVG元素并绑定数据。以下是我的例程://通过createElementNS创建svg元素并设置属性varsvg=document.createElementNS('http://www.w3.org/2000/svg','svg');svg.setAttribute("style"
- Ubuntu系统如何快速访问github
经纬数智
Linuxubuntugithub
ubuntu系统下,常常因为国内网络原因无法访问github官网或者也无法使用使用gitclone指令,搭建梯子又过于复杂,可使用修改hosts文件,添加IP地址的方法改进。修改Hosts文件:1.打开DNS查询网站:DNS查询。2.输入github域名:http://github.com,点击检测。3.选择合适的IP地址,复制。4.将IP地址复制到Hosts文件中。#打开Hosts文件sudog
- mysql直接在sql中将分组查询出来的多个属性的list,拼接成一个字符串,最后的结果只要一个大的字符串
CURRY30_1
mysqlsql数据库
如果你想要的是将所有分组的结果进一步合并成一个单独的、巨大的字符串(即整个查询结果只返回一个字符串),那么你需要借助子查询或者应用程序层面的逻辑。在纯SQL中,这通常不是直接支持的功能,因为SQL是为返回结果集而设计的,而不是单一字符串。SELECTGROUP_CONCAT(singleResSEPARATOR'\n')ASlastResFROM(selectCONCAT('field1:',yo
- 本类方法调用,如何使事务依然生效;调用本类方法为什么要用AopContext.currentProxy()
CURRY30_1
mybatisjava
springAOP中只会切入代理类,从一个类调用另外另外一个类的时候,是会生成代理对象的。但是如果是本类方法的互相调用,那么就不会生成代理对象,随之方法配置的事务也会失效。那么我们可以使用两种方法来避免这种事务失效的问题1.((Service)AopContext.currentProxy()).B()来调用B方法,用这种方式,即使是本类方法的互相调用也能生成代理对象啦((Service)AopC
- 直接在SQL中对日期格式进行转换yyyy/MM/dd到yyyy-MM-dd【DATE_FORMAT()】
CURRY30_1
sql数据库
可以直接在SQL中转换日期的格式会使用到DATE_FORMAT()使用函数DATE_FORMAT()函数中需要输入两个参数:原本的日期和你期待的模式字符串例如:我们要将2022/05/09的字符串转换成2022-05-09的格式,就可以用以下两种方式①:SELECTDATE_FORMAT('2022/05/09','20%y-%m-%d')DATE;②:SELECTDATE_FORMAT('202
- 【华为OD-E卷 - VLAN资源池 100分(python、java、c++、js、c)】
CodeClimb
算法题华为od(A+B+C+D+E卷)收录分享java华为odpythonc++javascript
【华为OD-E卷-VLAN资源池100分(python、java、c++、js、c)】题目VLAN是一种对局域网设备进行逻辑划分的技术,为了标识不同的VLAN,引入VLANID(1-4094之间的整数)的概念。定义一个VLANID的资源池(下称VLAN资源池),资源池中连续的VLAN用开始VLAN-结束VLAN表示,不连续的用单个整数表示,所有的VLAN用英文逗号连接起来。现在有一个VLAN资源池
- C++设计模式——Strategy策略模式
程序员与背包客_CoderZ
C/C++设计模式c++设计模式策略模式c语言开发语言
一,策略模式简介策略模式是一种行为型设计模式,策略模式在软件开发场景中定义了一系列的算法,并将每个算法单独封装在可替换的对象中,使应用程序在运行时可以根据具体的上下文来动态地选择和切换算法,同时保持原有的代码架构不被修改。策略模式的设计使得算法的实现与调用被分离,让算法可以独立于外部客户端进行开发和改动,使用独立的类来封装特定的算法,也避免了不同算法策略之间的互相影响。策略模式能适应多种应用场景,
- amazon-kinesis-video-streams-webrtc-sdk-c 移植到linux开发板
CSDN369369
webrtcc语言linux
大部分参考这位大神的资料分析依赖关系。通过分析Cmakelist.txt得出了一些依赖关系。libkvsWebrtcClient.so依赖项如下:libkvspicUtils.alibkvspicState.alibssl.solibcrypto.solibsrtp2.a.libusrsctp.solibkvsWebrtcSignalingClient.so依赖项如下:libkvsCommonLw
- HSM能为区块链、IoT等新兴技术提供怎样的保护?
Anna_Tong
区块链物联网iothsm数据加密
随着区块链和物联网(IoT)技术的快速发展,数据安全已成为最为关键的挑战之一。在这些技术的应用中,涉及到大量的敏感数据和交易信息,因此如何确保数据的机密性、完整性和真实性,成为了亟待解决的问题。硬件安全模块(HSM)作为一种高度安全的加密服务技术,正日益成为保障区块链和IoT技术安全的核心工具。HSM具体能为区块链和IoT做些什么?它又是如何保护这些技术免受安全威胁的呢?HSM在区块链中的应用:密
- 关于旗正规则引擎中的MD5加密问题
何必如此
jspMD5规则加密
一般情况下,为了防止个人隐私的泄露,我们都会对用户登录密码进行加密,使数据库相应字段保存的是加密后的字符串,而非原始密码。
在旗正规则引擎中,通过外部调用,可以实现MD5的加密,具体步骤如下:
1.在对象库中选择外部调用,选择“com.flagleader.util.MD5”,在子选项中选择“com.flagleader.util.MD5.getMD5ofStr({arg1})”;
2.在规
- 【Spark101】Scala Promise/Future在Spark中的应用
bit1129
Promise
Promise和Future是Scala用于异步调用并实现结果汇集的并发原语,Scala的Future同JUC里面的Future接口含义相同,Promise理解起来就有些绕。等有时间了再仔细的研究下Promise和Future的语义以及应用场景,具体参见Scala在线文档:http://docs.scala-lang.org/sips/completed/futures-promises.html
- spark sql 访问hive数据的配置详解
daizj
spark sqlhivethriftserver
spark sql 能够通过thriftserver 访问hive数据,默认spark编译的版本是不支持访问hive,因为hive依赖比较多,因此打的包中不包含hive和thriftserver,因此需要自己下载源码进行编译,将hive,thriftserver打包进去才能够访问,详细配置步骤如下:
1、下载源码
2、下载Maven,并配置
此配置简单,就略过
- HTTP 协议通信
周凡杨
javahttpclienthttp通信
一:简介
HTTPCLIENT,通过JAVA基于HTTP协议进行点与点间的通信!
二: 代码举例
测试类:
import java
- java unix时间戳转换
g21121
java
把java时间戳转换成unix时间戳:
Timestamp appointTime=Timestamp.valueOf(new SimpleDateFormat("yyyy-MM-dd HH:mm:ss").format(new Date()))
SimpleDateFormat df = new SimpleDateFormat("yyyy-MM-dd hh:m
- web报表工具FineReport常用函数的用法总结(报表函数)
老A不折腾
web报表finereport总结
说明:本次总结中,凡是以tableName或viewName作为参数因子的。函数在调用的时候均按照先从私有数据源中查找,然后再从公有数据源中查找的顺序。
CLASS
CLASS(object):返回object对象的所属的类。
CNMONEY
CNMONEY(number,unit)返回人民币大写。
number:需要转换的数值型的数。
unit:单位,
- java jni调用c++ 代码 报错
墙头上一根草
javaC++jni
#
# A fatal error has been detected by the Java Runtime Environment:
#
# EXCEPTION_ACCESS_VIOLATION (0xc0000005) at pc=0x00000000777c3290, pid=5632, tid=6656
#
# JRE version: Java(TM) SE Ru
- Spring中事件处理de小技巧
aijuans
springSpring 教程Spring 实例Spring 入门Spring3
Spring 中提供一些Aware相关de接口,BeanFactoryAware、 ApplicationContextAware、ResourceLoaderAware、ServletContextAware等等,其中最常用到de匙ApplicationContextAware.实现ApplicationContextAwaredeBean,在Bean被初始后,将会被注入 Applicati
- linux shell ls脚本样例
annan211
linuxlinux ls源码linux 源码
#! /bin/sh -
#查找输入文件的路径
#在查找路径下寻找一个或多个原始文件或文件模式
# 查找路径由特定的环境变量所定义
#标准输出所产生的结果 通常是查找路径下找到的每个文件的第一个实体的完整路径
# 或是filename :not found 的标准错误输出。
#如果文件没有找到 则退出码为0
#否则 即为找不到的文件个数
#语法 pathfind [--
- List,Set,Map遍历方式 (收集的资源,值得看一下)
百合不是茶
listsetMap遍历方式
List特点:元素有放入顺序,元素可重复
Map特点:元素按键值对存储,无放入顺序
Set特点:元素无放入顺序,元素不可重复(注意:元素虽然无放入顺序,但是元素在set中的位置是有该元素的HashCode决定的,其位置其实是固定的)
List接口有三个实现类:LinkedList,ArrayList,Vector
LinkedList:底层基于链表实现,链表内存是散乱的,每一个元素存储本身
- 解决SimpleDateFormat的线程不安全问题的方法
bijian1013
javathread线程安全
在Java项目中,我们通常会自己写一个DateUtil类,处理日期和字符串的转换,如下所示:
public class DateUtil01 {
private SimpleDateFormat dateformat = new SimpleDateFormat("yyyy-MM-dd HH:mm:ss");
public void format(Date d
- http请求测试实例(采用fastjson解析)
bijian1013
http测试
在实际开发中,我们经常会去做http请求的开发,下面则是如何请求的单元测试小实例,仅供参考。
import java.util.HashMap;
import java.util.Map;
import org.apache.commons.httpclient.HttpClient;
import
- 【RPC框架Hessian三】Hessian 异常处理
bit1129
hessian
RPC异常处理概述
RPC异常处理指是,当客户端调用远端的服务,如果服务执行过程中发生异常,这个异常能否序列到客户端?
如果服务在执行过程中可能发生异常,那么在服务接口的声明中,就该声明该接口可能抛出的异常。
在Hessian中,服务器端发生异常,可以将异常信息从服务器端序列化到客户端,因为Exception本身是实现了Serializable的
- 【日志分析】日志分析工具
bit1129
日志分析
1. 网站日志实时分析工具 GoAccess
http://www.vpsee.com/2014/02/a-real-time-web-log-analyzer-goaccess/
2. 通过日志监控并收集 Java 应用程序性能数据(Perf4J)
http://www.ibm.com/developerworks/cn/java/j-lo-logforperf/
3.log.io
和
- nginx优化加强战斗力及遇到的坑解决
ronin47
nginx 优化
先说遇到个坑,第一个是负载问题,这个问题与架构有关,由于我设计架构多了两层,结果导致会话负载只转向一个。解决这样的问题思路有两个:一是改变负载策略,二是更改架构设计。
由于采用动静分离部署,而nginx又设计了静态,结果客户端去读nginx静态,访问量上来,页面加载很慢。解决:二者留其一。最好是保留apache服务器。
来以下优化:
- java-50-输入两棵二叉树A和B,判断树B是不是A的子结构
bylijinnan
java
思路来自:
http://zhedahht.blog.163.com/blog/static/25411174201011445550396/
import ljn.help.*;
public class HasSubtree {
/**Q50.
* 输入两棵二叉树A和B,判断树B是不是A的子结构。
例如,下图中的两棵树A和B,由于A中有一部分子树的结构和B是一
- mongoDB 备份与恢复
开窍的石头
mongDB备份与恢复
Mongodb导出与导入
1: 导入/导出可以操作的是本地的mongodb服务器,也可以是远程的.
所以,都有如下通用选项:
-h host 主机
--port port 端口
-u username 用户名
-p passwd 密码
2: mongoexport 导出json格式的文件
- [网络与通讯]椭圆轨道计算的一些问题
comsci
网络
如果按照中国古代农历的历法,现在应该是某个季节的开始,但是由于农历历法是3000年前的天文观测数据,如果按照现在的天文学记录来进行修正的话,这个季节已经过去一段时间了。。。。。
也就是说,还要再等3000年。才有机会了,太阳系的行星的椭圆轨道受到外来天体的干扰,轨道次序发生了变
- 软件专利如何申请
cuiyadll
软件专利申请
软件技术可以申请软件著作权以保护软件源代码,也可以申请发明专利以保护软件流程中的步骤执行方式。专利保护的是软件解决问题的思想,而软件著作权保护的是软件代码(即软件思想的表达形式)。例如,离线传送文件,那发明专利保护是如何实现离线传送文件。基于相同的软件思想,但实现离线传送的程序代码有千千万万种,每种代码都可以享有各自的软件著作权。申请一个软件发明专利的代理费大概需要5000-8000申请发明专利可
- Android学习笔记
darrenzhu
android
1.启动一个AVD
2.命令行运行adb shell可连接到AVD,这也就是命令行客户端
3.如何启动一个程序
am start -n package name/.activityName
am start -n com.example.helloworld/.MainActivity
启动Android设置工具的命令如下所示:
# am start -
- apache虚拟机配置,本地多域名访问本地网站
dcj3sjt126com
apache
现在假定你有两个目录,一个存在于 /htdocs/a,另一个存在于 /htdocs/b 。
现在你想要在本地测试的时候访问 www.freeman.com 对应的目录是 /xampp/htdocs/freeman ,访问 www.duchengjiu.com 对应的目录是 /htdocs/duchengjiu。
1、首先修改C盘WINDOWS\system32\drivers\etc目录下的
- yii2 restful web服务[速率限制]
dcj3sjt126com
PHPyii2
速率限制
为防止滥用,你应该考虑增加速率限制到您的API。 例如,您可以限制每个用户的API的使用是在10分钟内最多100次的API调用。 如果一个用户同一个时间段内太多的请求被接收, 将返回响应状态代码 429 (这意味着过多的请求)。
要启用速率限制, [[yii\web\User::identityClass|user identity class]] 应该实现 [[yii\filter
- Hadoop2.5.2安装——单机模式
eksliang
hadoophadoop单机部署
转载请出自出处:http://eksliang.iteye.com/blog/2185414 一、概述
Hadoop有三种模式 单机模式、伪分布模式和完全分布模式,这里先简单介绍单机模式 ,默认情况下,Hadoop被配置成一个非分布式模式,独立运行JAVA进程,适合开始做调试工作。
二、下载地址
Hadoop 网址http:
- LoadMoreListView+SwipeRefreshLayout(分页下拉)基本结构
gundumw100
android
一切为了快速迭代
import java.util.ArrayList;
import org.json.JSONObject;
import android.animation.ObjectAnimator;
import android.os.Bundle;
import android.support.v4.widget.SwipeRefreshLayo
- 三道简单的前端HTML/CSS题目
ini
htmlWeb前端css题目
使用CSS为多个网页进行相同风格的布局和外观设置时,为了方便对这些网页进行修改,最好使用( )。http://hovertree.com/shortanswer/bjae/7bd72acca3206862.htm
在HTML中加入<table style=”color:red; font-size:10pt”>,此为( )。http://hovertree.com/s
- overrided方法编译错误
kane_xie
override
问题描述:
在实现类中的某一或某几个Override方法发生编译错误如下:
Name clash: The method put(String) of type XXXServiceImpl has the same erasure as put(String) of type XXXService but does not override it
当去掉@Over
- Java中使用代理IP获取网址内容(防IP被封,做数据爬虫)
mcj8089
免费代理IP代理IP数据爬虫JAVA设置代理IP爬虫封IP
推荐两个代理IP网站:
1. 全网代理IP:http://proxy.goubanjia.com/
2. 敲代码免费IP:http://ip.qiaodm.com/
Java语言有两种方式使用代理IP访问网址并获取内容,
方式一,设置System系统属性
// 设置代理IP
System.getProper
- Nodejs Express 报错之 listen EADDRINUSE
qiaolevip
每天进步一点点学习永无止境nodejs纵观千象
当你启动 nodejs服务报错:
>node app
Express server listening on port 80
events.js:85
throw er; // Unhandled 'error' event
^
Error: listen EADDRINUSE
at exports._errnoException (
- C++中三种new的用法
_荆棘鸟_
C++new
转载自:http://news.ccidnet.com/art/32855/20100713/2114025_1.html
作者: mt
其一是new operator,也叫new表达式;其二是operator new,也叫new操作符。这两个英文名称起的也太绝了,很容易搞混,那就记中文名称吧。new表达式比较常见,也最常用,例如:
string* ps = new string("
- Ruby深入研究笔记1
wudixiaotie
Ruby
module是可以定义private方法的
module MTest
def aaa
puts "aaa"
private_method
end
private
def private_method
puts "this is private_method"
end
end