【机器学习】K近邻(KNN)算法详解
一、算法介绍
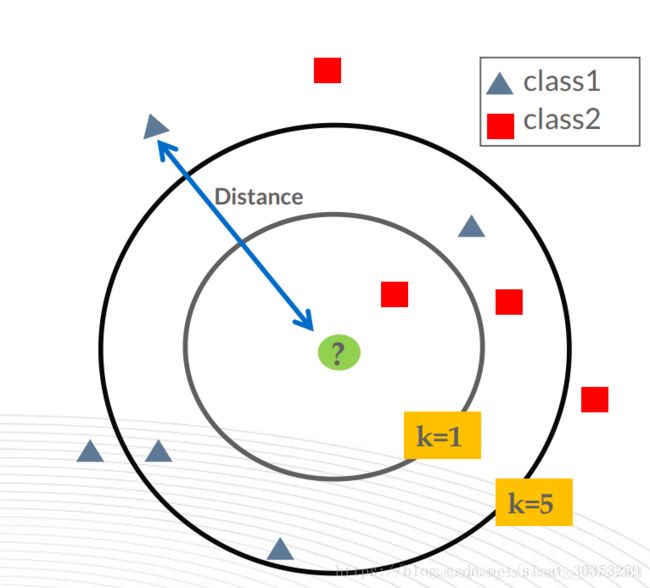
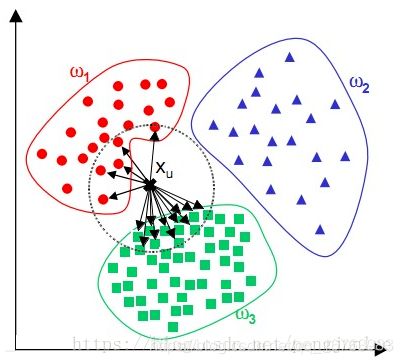
- KNN(K Near Neighbor):k个最近的邻居,即每个样本都可以用它最接近的k个邻居来代表。KNN算法属于监督学习方式的分类算法,我的理解就是计算某给点到每个点的距离作为相似度的反馈。
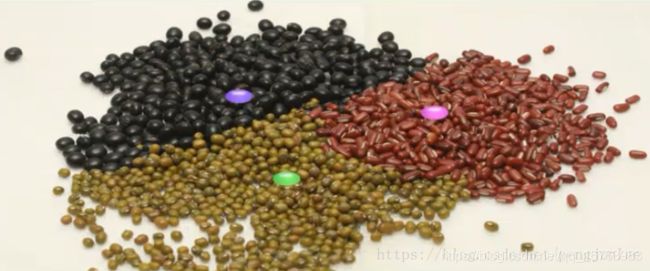
- 简单来讲,KNN就是“近朱者赤,近墨者黑”的一种分类算法。
- KNN是一种基于实例的学习,属于懒惰学习,即没有显式学习过程。
- 要区分一下聚类(如Kmeans等),KNN是监督学习分类,而Kmeans是无监督学习的聚类,聚类将无标签的数据分成不同的簇。
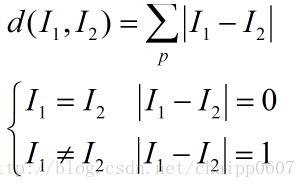
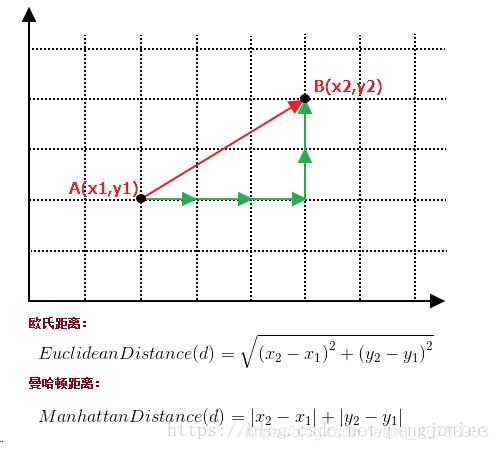
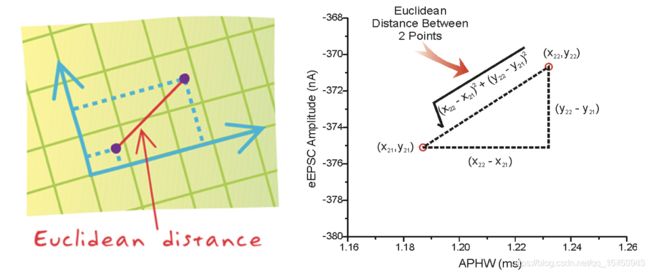
二、距离度量
三、参数K值分析
3.1 K的选取
在scikit-learn重KNN算法的K值是通过n_neighbors参数来调节的,默认值是5。
参考李航博士一书统计学习方法中写道的K值选择:
- K值小,相当于用较小的领域中的训练实例进行预测,只要与输入实例相近的实例才会对预测结果,模型变得复杂,只要改变一点点就可能导致分类结果出错,泛化性不佳。(学习近似误差小,但是估计误差增大,过拟合)
- K值大,相当于用较大的领域中的训练实例进行预测,与输入实例较远的实例也会对预测结果产生影响,模型变得简单,可能预测出错。(学习近似误差大,但是估计误差小,欠拟合)
- 极端情况:K=0,没有可以类比的邻居;K=N,模型太简单,输出的分类就是所有类中数量最多的,距离都没有产生作用。
- 近似误差:训练集上的误差
- 估计误差:测试集上的误差
3.2 交叉验证法搜索最优K值
确定K值时用到交叉验证,什么是交叉验证法?
交叉验证技术叫做K折交叉验证(K-fold Cross Validation),将整个数据集拆分成训练集和测试集,在训练集上训练模型,在测试集上评估模型。
用sklearn中的KFold进行K折交叉验证
import numpy as np
from sklearn import datasets
from sklearn.neighbors import KNeighborsClassifier
from sklearn.model_selection import KFold  #主要用于K折交叉验证

# 导入iris数据集
iris=datasets.load_iris()
X=iris.data
y=iris.target
print(X.shape,y.shape)
# 定义我们想要搜索的K值(候选集),这里定义8个不同的值
ks=[1,3,5,7,9,11,13,15]

# 例:进行5折交叉验证,KFold返回的是每一折中训练数据和验证数据的index
# 假设数据样本为:[1,3,5,6,11,12,43,12,44,2],总共10个样本
# 则返回的kf的格式为(前面的是训练数据,后面的是验证数据):
# [0,1,3,5,6,7,8,9],[2,4]
# [0,1,2,4,6,7,8,9],[3,5]
# [1,2,3,4,5,6,7,8],[0,9]
# [0,1,2,3,4,5,7,9],[6,8]
# [0,2,3,4,5,6,8,9],[1,7]
kf =KFold(n_splits=5, random_state=2001, shuffle=True)

# 保存当前最好的K值和对应的准确值
best_k = ks[0]
best_score = 0

# 循环每一个K值
for k in ks:
    curr_score=0
    for train_index, valid_index in kf.split(X):
        #每一折的训练以及计算准确率
        clf = KNeighborsClassifier(n_neighbors=k)
        clf.fit(X[train_index], y[train_index])
        curr_score = curr_score + clf.score(X[valid_index], y[valid_index])
    #求5折的平均准确率
    avg_score = curr_score/5
    if avg_score > best_score:
        best_k = k
        best_score = avg_score
    print("现在的最佳准确率:%.2f"%best_score, "现在的最佳K值 %d"%best_k)

print("最终最佳准确率:%.2f"%best_score, "最终的最佳K值 %d"%best_k)
(150, 4) (150,)
现在的最佳准确率:0.96 现在的最佳K值 1
现在的最佳准确率:0.96 现在的最佳K值 1
现在的最佳准确率:0.97 现在的最佳K值 5
现在的最佳准确率:0.98 现在的最佳K值 7
现在的最佳准确率:0.98 现在的最佳K值 7
现在的最佳准确率:0.98 现在的最佳K值 7
现在的最佳准确率:0.98 现在的最佳K值 7
现在的最佳准确率:0.98 现在的最佳K值 7
最终最佳准确率:0.98 最终的最佳K值 7
用网格方式GridSearchCV进行K折交叉验证
from sklearn import datasets
from sklearn.neighbors import KNeighborsClassifier
from sklearn.model_selection import GridSearchCV  #通过网络方式来获取参数

# 导入iris数据集
iris2 = datasets.load_iris()
X = iris2.data
y = iris2.target
print(X.shape, y.shape)

# 设置需要搜索的K值,'n_neighbors'是sklearn中KNN的参数
parameters = {'n_neighbors': [1,3,5,7,9,11,13,15]}
knn = KNeighborsClassifier() # 这里不用指定参数

# 通过GridSearchCV来搜索最好的K值。这个模块的内部其实就是对每一个K值进行评估
clf = GridSearchCV(knn, parameters, cv=5)  #5折
clf.fit(X, y)

# 输出最好的参数以及对应的准确率
print("最终最佳准确率:%.2f"%clf.best_score_,"最终的最佳K值",clf.best_params_)
(150, 4) (150,)
最终最佳准确率:0.98 最终的最佳K值 {'n_neighbors': 7}
K折交叉验证法参考:KNN交叉验证,找出合适的K值
四、算法流程
4.1 基本流程描述
- 计算当前点与所有点之间的距离
- 距离按照升序排列
- 选取距离最近的K个点
- 统计这K个点所在类别出现的频率
- 这K个点中出现频率最高的类别作为预测的分类
4.2 流程的代码实现
算法流程的代码实现过程:
假设有下面一些电影,不同的电影有不同的镜头比例,我们用KNN来进行分类。
| 电影名 | 搞笑镜头 | 拥抱镜头 | 打斗镜头 | 分类 |
|---|---|---|---|---|
| 宝贝当家 | 45 | 2 | 10 | 喜剧片 |
| 功夫熊猫3 | 40 | 5 | 35 | 喜剧片 |
| 举起手来 | 50 | 2 | 20 | 喜剧片 |
| 碟中谍2 | 5 | 2 | 60 | 动作片 |
| 叶问3 | 4 | 3 | 65 | 动作片 |
| 空中营救 | 1 | 2 | 63 | 动作片 |
| 怦然心动 | 5 | 30 | 1 | 爱情片 |
| 时空恋旅人 | 6 | 35 | 1 | 爱情片 |
| 恋恋笔记本 | 10 | 40 | 1 | 爱情片 |
加勒比海盗1": [15, 3, 60, “?片”],现在用KNN进行预测。
import math

movie_data = {
                "宝贝当家": [45, 2, 10, "喜剧片"],
                "功夫熊猫3": [40, 5, 35, "喜剧片"],
                "举起手来": [50, 2, 20., "喜剧片"],
                "碟中谍2": [5, 2, 60, "动作片"],
                "叶问3": [4, 3, 65, "动作片"],
                "空中营救": [1, 2, 63, "动作片"],
                "怦然心动": [5, 30, 1, "爱情片"],
                "时空恋旅人": [6, 35, 1, "爱情片"],
                "恋恋笔记本": [10, 40, 1, "爱情片"]
             }

# 测试样本: 加勒比海盗1": [15, 3, 60, "?片"]

#下面为求与数据集中所有数据的距离代码
x = [15, 3, 60]
KNN = []
for key, v in movie_data.items():
    d = math.sqrt((x[0] - v[0]) ** 2 + (x[1] - v[1]) ** 2 + (x[2] - v[2]) ** 2)
    KNN.append([key, round(d, 2)])

# 输出所用电影到加勒比海盗1的距离
print("KNN =", KNN)

#按照距离大小进行递增排序
KNN.sort(key = lambda dis: dis[1])

#选取距离最小的k个样本,这里取k=3;
KNN = KNN[0:3]
print("nearest5 KNN:", KNN)

#确定前k个样本所在类别出现的频率,并输出出现频率最高的类别
labels = {"喜剧片":0, "动作片":0, "爱情片":0}
for s in KNN:
    label = movie_data[s[0]]
    labels[label[3]] += 1
labels =sorted(labels.items(),key=lambda l: l[1],reverse=True)
print("labels:", labels)
print("prediction result:", labels[0][0])
KNN = [['宝贝当家', 58.32], ['功夫熊猫3', 35.41], ['举起手来', 53.16], ['碟中谍2', 10.05], ['叶问3', 12.08], ['空中营救', 14.35], ['怦然心动', 65.65], ['时空恋旅人', 67.72], ['恋恋笔记本', 69.82]]
nearest5 KNN: [['碟中谍2', 10.05], ['叶问3', 12.08], ['空中营救', 14.35]]
labels: [('动作片', 3), ('喜剧片', 0), ('爱情片', 0)]
prediction result: 动作片
一共有10个点,这里的k选择的是3(较小),如果选择6(较大)呢?
KNN = KNN[0:6]
labels: [('喜剧片', 3), ('动作片', 3), ('爱情片', 0)]
prediction result: 喜剧片
我发现,在最后统计分类出现频数的时候,喜剧片和动作片同样是3次,这就说明k选大了,较远的点也参与的预测。
五、KNN实际应用
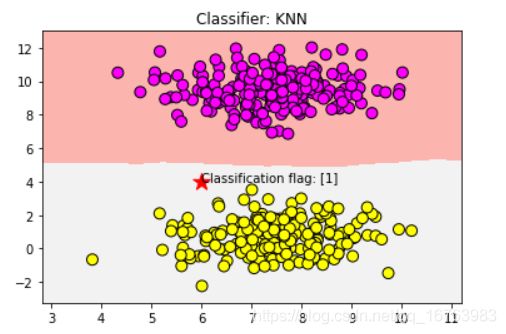
5.1 二分类
# 导入画图工具
import matplotlib.pyplot as plt
# 导入数组工具
import numpy as np
# 导入数据集生成器
from sklearn.datasets import make_blobs
# 导入KNN 分类器
from sklearn.neighbors import KNeighborsClassifier

# 生成样本数为200,分类数为2的数据集
data = make_blobs(n_samples=400, n_features=2,centers=2, cluster_std=1.0, random_state=8)
X,Y = data

clf = KNeighborsClassifier()
clf.fit(X, Y)

# 绘制图形
x_min,x_max = X[:,0].min()-1, X[:,0].max()+1
y_min,y_max = X[:,1].min()-1, X[:,1].max()+1
xx,yy = np.meshgrid(np.arange(x_min, x_max, .02), np.arange(y_min,y_max, .02))
z = clf.predict(np.c_[xx.ravel(), yy.ravel()])

z = z.reshape(xx.shape)
plt.pcolormesh(xx,yy,z,cmap=plt.cm.Pastel1)
plt.scatter(X[:,0], X[:,1],s=80, c=Y,  cmap=plt.cm.spring, edgecolors='k')
plt.xlim(xx.min(), xx.max())
plt.ylim(yy.min(), yy.max())
plt.title("Classifier: KNN")

# 把待分类的数据点用五星表示出来
plt.scatter(6, 4, marker='*', c='red', s=200)

# 对待分类的数据点的分类进行判断
res = clf.predict([[6, 4]])
plt.text(6, 4,'Classification flag: ' + str(res))

plt.show()
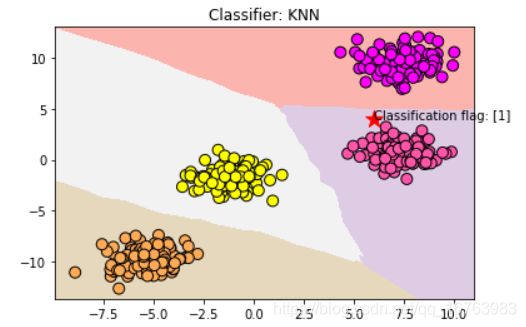
5.2 多元分类
# 导入画图工具
import matplotlib.pyplot as plt
# 导入数组工具
import numpy as np
# 导入数据集生成器
from sklearn.datasets import make_blobs
# 导入KNN 分类器
from sklearn.neighbors import KNeighborsClassifier

# 生成样本数为200,分类数为2的数据集
data = make_blobs(n_samples=400, n_features=2,centers=4, cluster_std=1.0, random_state=8)
X,Y = data

clf = KNeighborsClassifier()
clf.fit(X, Y)

# 绘制图形
x_min,x_max = X[:,0].min()-1, X[:,0].max()+1
y_min,y_max = X[:,1].min()-1, X[:,1].max()+1
xx,yy = np.meshgrid(np.arange(x_min, x_max, .02), np.arange(y_min,y_max, .02))
z = clf.predict(np.c_[xx.ravel(), yy.ravel()])

z = z.reshape(xx.shape)
plt.pcolormesh(xx,yy,z,cmap=plt.cm.Pastel1)
plt.scatter(X[:,0], X[:,1],s=80, c=Y,  cmap=plt.cm.spring, edgecolors='k')
plt.xlim(xx.min(), xx.max())
plt.ylim(yy.min(), yy.max())
plt.title("Classifier: KNN")

# 把待分类的数据点用五星表示出来
plt.scatter(6, 4, marker='*', c='red', s=200)

# 对待分类的数据点的分类进行判断
res = clf.predict([[6, 4]])
plt.text(6, 4,'Classification flag: ' + str(res))

plt.show()
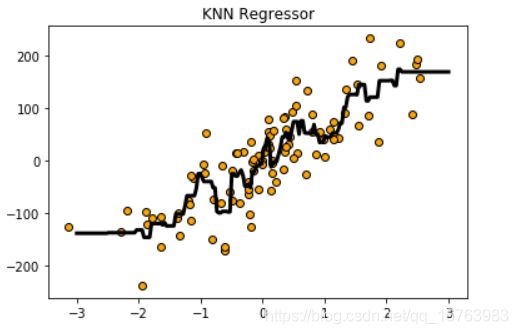
5.3 回归
# 导入画图工具
import matplotlib.pyplot as plt
# 导入数组工具
import numpy as np
# 导入用于回归分析的KNN模型
from sklearn.neighbors import KNeighborsRegressor

from sklearn.datasets.samples_generator import make_regression
from docutils.utils.math.math2html import LineWriter

# 生成样本数为200,分类数为2的数据集
X,Y = make_regression(n_samples=100,n_features=1,n_informative=1,noise=50,random_state=8)

reg = KNeighborsRegressor(n_neighbors=5)

reg.fit(X, Y)

# 将预测结果用图像进行可视化
z = np.linspace(-3, 3, 200).reshape(-1, 1)
plt.scatter(X, Y, c='orange', edgecolor='k')
plt.plot(z, reg.predict(z), c='k', Linewidth=3)
plt.title("KNN Regressor")

plt.show()
5.4 酒的分类
题意简述
每种酒有13种属性值,三种分类,数据集共有178杯酒,试着划分数据集后通过训练集进行训练KNN模型,在测试集上进行评估准确度,最后对新的一杯酒进行预测分类。
from sklearn.datasets.base import load_wine
from sklearn.model_selection import train_test_split
from sklearn.neighbors import KNeighborsClassifier
import numpy as np

# 从 sklearn的datasets模块载入数据集加载酒的数据集
wineDataSet=load_wine()
print("红酒数据集中的键:\n{}".format(wineDataSet.keys()))
print("数据概况:\n{}".format(wineDataSet['data'].shape))
print(wineDataSet['DESCR']) #很有用,把数据集中DESCR描述性质的信息打印出来,能知道有哪13种属性和哪3类酒

# 将数据集拆分为训练数据集和测试数据集
X_train,X_test,y_train,y_test=train_test_split(wineDataSet['data'],wineDataSet['target'],random_state=0)
print("X_train shape:{}".format(X_train.shape))
print("X_test shape:{}".format(X_test.shape))
print("y_train shape:{}".format(y_train.shape))
print("y_test shape:{}".format(y_test.shape))

knn = KNeighborsClassifier(n_neighbors=1)
knn.fit(X_train,y_train)

# 评估模型的准确率
print('测试数据集得分:{:.2f}'.format(knn.score(X_test,y_test)))

# 使用建好的模型对新酒进行分类预测
X_new = np.array([[13.2, 2.77, 2.51, 18.5, 96.6,1.04, 2.55, 0.57, 1.47, 6.2, 1.05, 3.33, 820]])
prediction = knn.predict(X_new)
print("预测新酒的分类为:{}".format(wineDataSet['target_names'][prediction]))
红酒数据集中的键:
dict_keys(['data', 'target', 'target_names', 'DESCR', 'feature_names'])
数据概况:
(178, 13)
.. _wine_dataset:

Wine recognition dataset
------------------------

**Data Set Characteristics:**

    :Number of Instances: 178 (50 in each of three classes)
    :Number of Attributes: 13 numeric, predictive attributes and the class
    :Attribute Information:
 		- Alcohol
 		- Malic acid
 		- Ash
		- Alcalinity of ash
 		- Magnesium
		- Total phenols
 		- Flavanoids
 		- Nonflavanoid phenols
 		- Proanthocyanins
		- Color intensity
 		- Hue
 		- OD280/OD315 of diluted wines
 		- Proline

    - class:
            - class_0
            - class_1
            - class_2

    :Summary Statistics:

    ============================= ==== ===== ======= =====
                                   Min   Max   Mean     SD
    ============================= ==== ===== ======= =====
    Alcohol:                      11.0  14.8    13.0   0.8
    Malic Acid:                   0.74  5.80    2.34  1.12
    Ash:                          1.36  3.23    2.36  0.27
    Alcalinity of Ash:            10.6  30.0    19.5   3.3
    Magnesium:                    70.0 162.0    99.7  14.3
    Total Phenols:                0.98  3.88    2.29  0.63
    Flavanoids:                   0.34  5.08    2.03  1.00
    Nonflavanoid Phenols:         0.13  0.66    0.36  0.12
    Proanthocyanins:              0.41  3.58    1.59  0.57
    Colour Intensity:              1.3  13.0     5.1   2.3
    Hue:                          0.48  1.71    0.96  0.23
    OD280/OD315 of diluted wines: 1.27  4.00    2.61  0.71
    Proline:                       278  1680     746   315
    ============================= ==== ===== ======= =====

    :Missing Attribute Values: None
    :Class Distribution: class_0 (59), class_1 (71), class_2 (48)
    :Creator: R.A. Fisher
    :Donor: Michael Marshall (MARSHALL%PLU@io.arc.nasa.gov)
    :Date: July, 1988

This is a copy of UCI ML Wine recognition datasets.
https://archive.ics.uci.edu/ml/machine-learning-databases/wine/wine.data

The data is the results of a chemical analysis of wines grown in the same
region in Italy by three different cultivators. There are thirteen different
measurements taken for different constituents found in the three types of
wine.

Original Owners:

Forina, M. et al, PARVUS -
An Extendible Package for Data Exploration, Classification and Correlation.
Institute of Pharmaceutical and Food Analysis and Technologies,
Via Brigata Salerno, 16147 Genoa, Italy.

Citation:

Lichman, M. (2013). UCI Machine Learning Repository
[https://archive.ics.uci.edu/ml]. Irvine, CA: University of California,
School of Information and Computer Science.

.. topic:: References

  (1) S. Aeberhard, D. Coomans and O. de Vel,
  Comparison of Classifiers in High Dimensional Settings,
  Tech. Rep. no. 92-02, (1992), Dept. of Computer Science and Dept. of
  Mathematics and Statistics, James Cook University of North Queensland.
  (Also submitted to Technometrics).

  The data was used with many others for comparing various
  classifiers. The classes are separable, though only RDA
  has achieved 100% correct classification.
  (RDA : 100%, QDA 99.4%, LDA 98.9%, 1NN 96.1% (z-transformed data))
  (All results using the leave-one-out technique)

  (2) S. Aeberhard, D. Coomans and O. de Vel,
  "THE CLASSIFICATION PERFORMANCE OF RDA"
  Tech. Rep. no. 92-01, (1992), Dept. of Computer Science and Dept. of
  Mathematics and Statistics, James Cook University of North Queensland.
  (Also submitted to Journal of Chemometrics).

X_train shape:(133, 13)
X_test shape:(45, 13)
y_train shape:(133,)
y_test shape:(45,)
测试数据集得分:0.76
预测新酒的分类为:['class_2']
若将n_neighbors从1调整到4
knn = KNeighborsClassifier(n_neighbors=4)
结果会略有改善
测试数据集得分:0.78
预测新酒的分类为:['class_2']
KNN实战参考:机器学习之KNN最邻近分类算法
六、KNN优缺点及适用场景
优点
- 流程简单明了,易于实现
- 方便进行多分类任务,效果优于SVM
- 适合对稀有事件进行分类
缺点
- 计算量大, T = O ( n ) T=O(n) T=O(n),需要计算到每个点的距离
- 样本不平衡时(一些分类数量少,一些多),前K个样本中大容量类别占据多数,这种情况会影响到分类结果
- K太小过拟合,K太大欠拟合,K较难决定得完美,通过交叉验证确定K
适用场景
- 多分类问题
- 稀有事件分类问题
- 文本分类问题
- 模式识别
- 聚类分析
- 样本数量较少的分类问题
