模拟生命
模拟生命类似一个小游戏,可以假设有很多个小生命,或小细胞,可生可灭,具体k看这个细胞邻居的多少,规则如下,更多参见:
The universe of the Game of Life is an infinite two-dimensional orthogonal grid of square cells, each of which is in one of two possible states, live or dead. Every cell interacts with its eight neighbours, which are the cells that are directly horizontally, vertically, or diagonally adjacent. At each step in time, the following transitions occur:
- Any live cell with fewer than two live neighbours dies, as if by needs caused by underpopulation.
- Any live cell with more than three live neighbours dies, as if by overcrowding.
- Any live cell with two or three live neighbours lives, unchanged, to the next generation.
- Any dead cell with exactly three live neighbours becomes a live cell.
The initial pattern constitutes the 'seed' of the system. The first generation is created by applying the above rules simultaneously to every cell in the seed – births and deaths happen simultaneously, and the discrete moment at which this happens is sometimes called a tick. (In other words, each generation is a pure function of the one before.) The rules continue to be applied repeatedly to create further generations.
目标就是根据这些规则,确定经过若干次演变后,生命的形态,哪些细胞生,哪些细胞灭。例如:
Z = np.array([[0,0,0,0,0,0],
              [0,0,0,1,0,0],
              [0,1,0,1,0,0],
              [0,0,1,1,0,0],
              [0,0,0,0,0,0],
              [0,0,0,0,0,0]])
演变后就是
array([[0, 0, 0, 0, 0, 0],
       [0, 0, 0, 1, 0, 0],
       [0, 0, 0, 0, 1, 0],
       [0, 0, 1, 1, 1, 0],
       [0, 0, 0, 0, 0, 0],
       [0, 0, 0, 0, 0, 0]])
算法的关键是确定每个细胞的邻居多少,以决定生死,且假定边界均死,用0表示。
def evolve(Z):
    N = (Z[0:-2,0:-2] + Z[0:-2,1:-1] + Z[0:-2,2:] +
         Z[1:-1,0:-2]                + Z[1:-1,2:] +
         Z[2:  ,0:-2] + Z[2:  ,1:-1] + Z[2:  ,2:])
    # Apply rules
    birth = (N==3) & (Z[1:-1,1:-1]==0) #若本来死,且邻居为3,则复活
    survive = ((N==2) | (N==3)) & (Z[1:-1,1:-1]==1) # 若本来活,且邻居为2 or 3,则幸存
    Z[...] = 0 # 重置为0
    Z[1:-1,1:-1][birth | survive] = 1 # 复活或幸存的置为1
    return Z
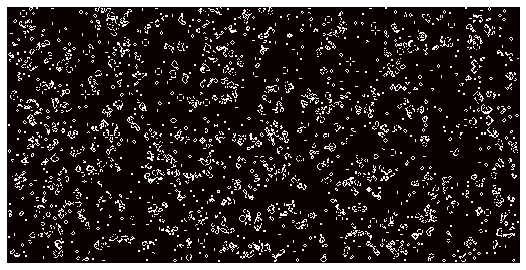
Z = np.random.randint(0,2,(256,512))
for i in range(100): evolve(Z)
# plot
size = np.array(Z.shape)
dpi = 72.0
figsize= size[1]/float(dpi),size[0]/float(dpi)
fig = plt.figure(figsize=figsize, dpi=dpi, facecolor="white")
fig.add_axes([0.0, 0.0, 1.0, 1.0], frameon=False)
plt.imshow(Z,interpolation='nearest', cmap=plt.cm.hot)
plt.xticks([]), plt.yticks([])
plt.show()