MATLAB正月点灯笼老师课程笔记:第三课:画图
用MATLAB画图:
x = [1 2 3];
y = [4 5 6];
plot(x, y)
x = -3:3;  % 表示一个从-3 到3 的向量(数组)
y = x .* x; % .* 表示数组 x 中对应位元素相乘
% 也可以用 y = x .^ 2; 代替(还是要加点)
若觉得曲线不够平滑,也可以设置步长 -3:0.1:3
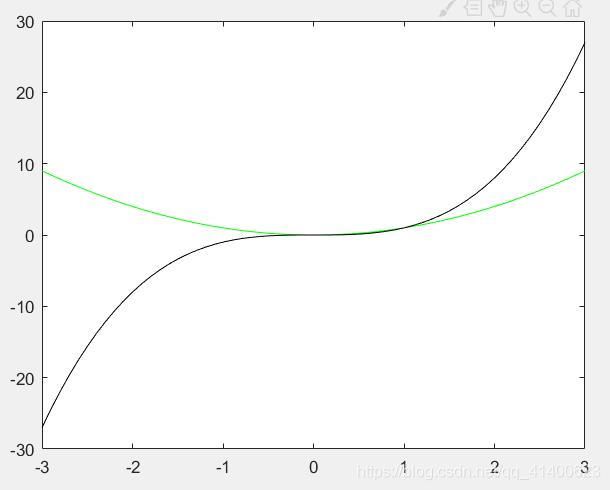
还可以设置颜色
>> x = -3 : 0.1 : 3;
>> y1 = x .^ 2;
>> y2 = x .^ 3;
>> plot(x, y1, 'green', x, y2, 'black')
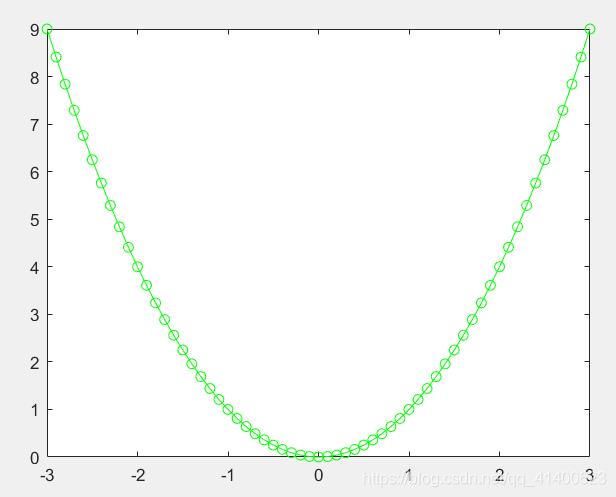
plot(x, y1, 'green-o')
 % - 表示用直线连接;o 表示在关键点上用圆圈标识出来
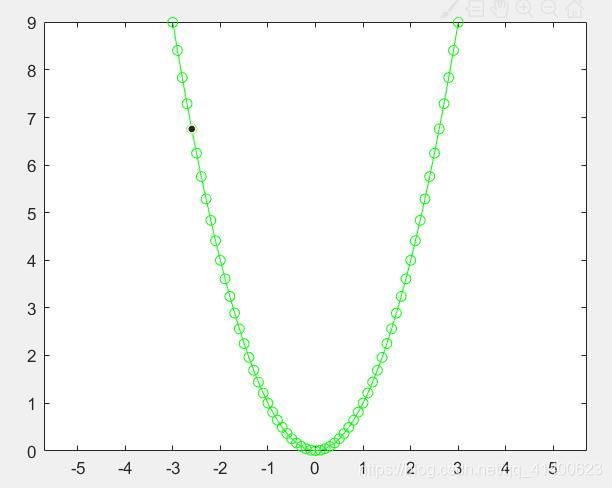
axis equal
% 执行此命令后,会将图形的横纵坐标轴变为标度长度相同
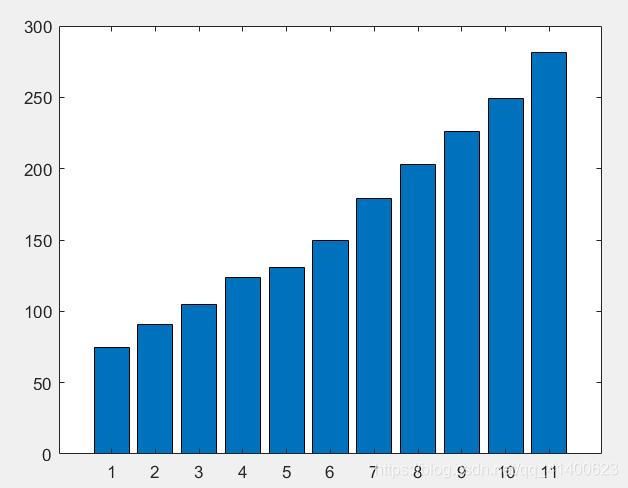
>> y = [75 91 105 123.5 131 150 179 203 226 249 281.5];
>> bar(y)
>> x = 2000:2010;
>> bar(x, y)
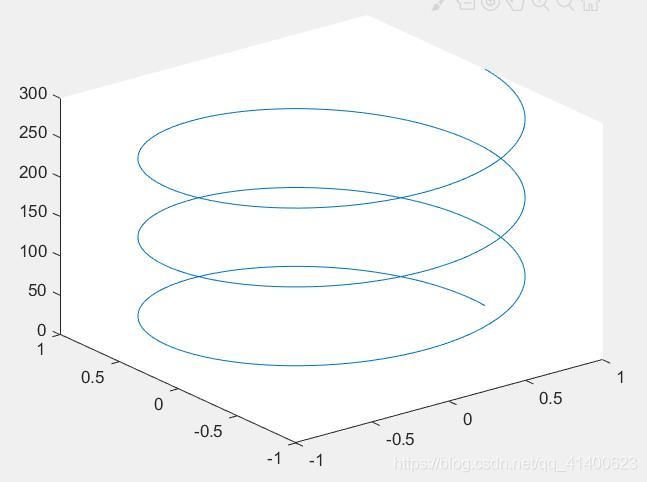
>> theta = 0 : pi/50 : 6*pi;   % 期待中的图形是螺旋环绕向上三圈的
>> x = cos(theta);
>> y = sin(theta);
>> z = 0 : 300;  % 因为前面的 x 和 y 可以通过变量区看到是301个值
>> plot3(x, y, z)   % plot3 表示绘制三维图形
x = -5 : 0.1 : 5;
y = x .^2;
plot(x, y);

hold on;

x2 = -5:0.1:5;
y2 = x2 .^3;
plot(x2, y2);
x = -5 : 0.1 : 5;
y = x .^2;
plot(x, y);

hold on;

x2 = -5:0.1:5;
y2 = x2 .^3;
plot(x2, y2);

grid on;
title('x^2 vs x^3');
在 x 轴和 y 轴上加标签:
xlabel('x-axis');
ylabel('y-axis');
在同一个窗口上画多个图像:
subplot(2,3,1);  %表示将整个窗口分成2行,每行3个图,在第一个图的位置作画
% 此时总共有6个图可以画    前面两个变量表示行和列
例:
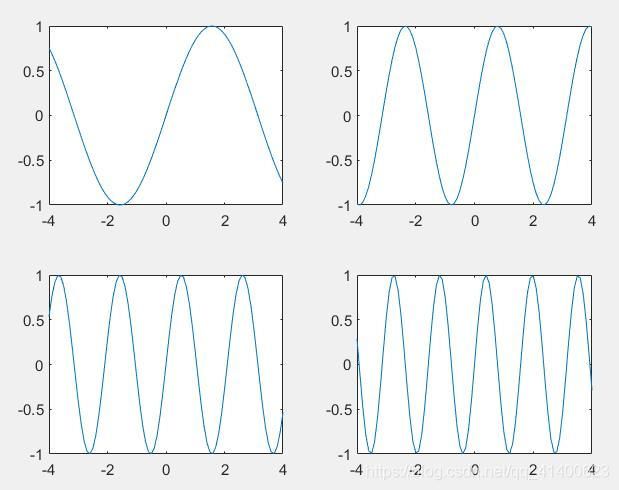
x = -4:0.1:4;

y1=sin(x);
y2=sin(2.*x);
y3=sin(3.*x);
y4=sin(4.*x);

subplot(2,2,1);
plot(x, y1);
subplot(2,2,2);
plot(x, y2);
subplot(2,2,3);
plot(x, y3);
subplot(2,2,4);
plot(x, y4);
subplot(2,2,1);
plot(x, y1);
title('y = sin(x)');

subplot(2,2,2);
plot(x, y2);
title('y = sin(2x)');

subplot(2,2,3);
plot(x, y3);
title('y = sin(3x)');

subplot(2,2,4);
plot(x, y4);
title('y = sin(4x)');
将整个图形区域分成3块,第一行2个图,第二行在中间1个图:subplot(2,2,[3,4]);
subplot(2,2,[3,4]); % 表示这个图同时占了3 和 4 两个位置
plot(x, y3);
title('y = cos(4x)');

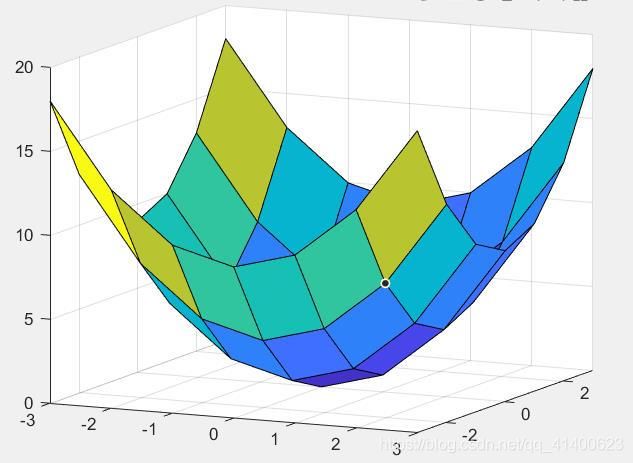
三维曲面的绘制:surf(x, y, z) surface 的缩写
x = -3 : 3;
 y = -3 : 3;
 [X, Y] = meshgrid(x, y);  % meshgrid:生成绘制3D图形所需的网格数据
X和Y分别为:
X =
-3    -2    -1     0     1     2     3
-3    -2    -1     0     1     2     3
-3    -2    -1     0     1     2     3
-3    -2    -1     0     1     2     3
-3    -2    -1     0     1     2     3
-3    -2    -1     0     1     2     3
-3    -2    -1     0     1     2     3
Y =
-3    -3    -3    -3    -3    -3    -3
-2    -2    -2    -2    -2    -2    -2
-1    -1    -1    -1    -1    -1    -1
 0     0     0     0     0     0     0
 1     1     1     1     1     1     1
 2     2     2     2     2     2     2
 3     3     3     3     3     3     3
Z = X .^2 + Y .^2;
surf(X,Y,Z);
% 此时便可画出x^2+y^2的3D图形

