用线性回归对房价进行预测-代码实战
from IPython.core.interactiveshell import InteractiveShell
InteractiveShell.ast_node_interactivity = “all”
#-- coding: utf-8 --
“”"
@author: CDA教研组
申明:CDA版权所有
官网:http://edu.cda.cn
“”"
‘\n@author: CDA教研组\n申明:CDA版权所有\n官网:http://edu.cda.cn\n\n’
import numpy as np
import pandas as pd
import os
os.getcwd() # 工作路径
#os.chdir(r"E:\大数据实验室_教研部案例集\案例2_房价预测") # 设置默认路径
‘C:\Users\CDA\Desktop\Python\20211121敏捷’
导入数据
#导入数据集
data_raw = pd.read_excel(“LR_practice.xlsx”)
http://data_raw.info()
data_raw.head()
RangeIndex: 76 entries, 0 to 75
Data columns (total 12 columns):
#Column Non-Null Count Dtype
0 id 76 non-null int64
1 Acc 76 non-null int64
2 avg_exp 70 non-null float64
3 gender 76 non-null object
4 Age 76 non-null int64
5 Income 76 non-null float64
6 Ownrent 76 non-null int64
7 Selfempl 76 non-null int64
8 dist_home_val 76 non-null float64
9 dist_avg_income 76 non-null float64
10 edad2 76 non-null int64
11 edu_class 75 non-null object
dtypes: float64(4), int64(6), object(2)
memory usage: 7.2+ KB

数据清洗
#删除无用变量
data_raw.drop([“id”, “Acc”, “edad2”], axis = 1, inplace = True)
#重复值
data_raw = data_raw.drop_duplicates()
#缺失值
#完整代码和更多课程请见http://edu.cda.cn敏捷算法
avg_exp 0.078947
gender 0.000000
Age 0.000000
Income 0.000000
Ownrent 0.000000
Selfempl 0.000000
dist_home_val 0.000000
dist_avg_income 0.000000
edu_class 0.013158
dtype: float64
data_raw[“avg_exp”] = data_raw[“avg_exp”].fillna(data_raw[“avg_exp”].mean())
#数据编码
#完整代码和更多课程请见http://edu.cda.cn敏捷算法
data_raw[“gender”]
0 1
1 1
2 1
3 1
4 1
…
71 0
72 0
73 0
74 0
75 0
Name: gender, Length: 76, dtype: int64
#用更酷炫的方法同时实现数据编码与缺失值处理(请重新加载数据)
#完整代码和更多课程请见http://edu.cda.cn敏捷算法
label = data_raw[“edu_class”].unique().tolist()
label
[‘研究生’, ‘大学’, ‘中学’, ‘小学及以下’, nan]
#完整代码和更多课程请见http://edu.cda.cn敏捷算法
data_raw[“edu_class”]
0 0
1 1
2 0
3 1
4 0
…
71 2
72 2
73 2
74 2
75 3
Name: edu_class, Length: 76, dtype: int64
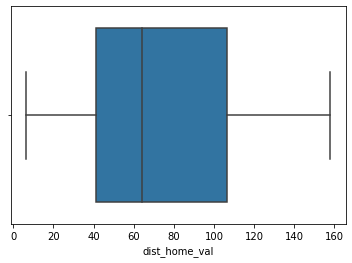
#异常值的筛查
import seaborn
#完整代码和更多课程请见http://edu.cda.cn敏捷算法

#完整代码和更多课程请见http://edu.cda.cn敏捷算法
AxesSubplot:xlabel=‘Age’

from scipy import stats
z = np.abs(stats.zscore(data_raw[“Age”]))
(z > 3) | (z < -3) # \ 是位置或,这里专用于numpy环境,实现效果和 or 一样
0 False
1 False
2 False
3 False
4 False
…
71 False
72 False
73 False
74 False
75 False
Name: Age, Length: 76, dtype: bool
z_outlier = (z > 3) | (z < -3)
z_outlier.tolist().index(1)
40
data_raw[“Age”].iloc[40]
999
data_raw[“Age”].drop(index = 40).mean()
31.213333333333335
data_raw[“Age”].iloc[40] = data_raw[“Age”].drop(index = 40).mean()
C:\Users\CDA\anaconda3\lib\site-packages\pandas\core\indexing.py:1732: SettingWithCopyWarning:
A value is trying to be set on a copy of a slice from a DataFrame
See the caveats in the documentation: https://pandas.pydata.org/pandas-docs/stable/user_guide/indexing.html#returning-a-view-versus-a-copy
self._setitem_single_block(indexer, value, name)
#用3倍标准差去筛缺失值,一般只做一次。多次做的话有可能把本不是缺失值的算成缺失值
#完整代码和更多课程请见http://edu.cda.cn敏捷算法
0 False
1 False
2 False
3 False
4 False
…
71 False
72 False
73 False
74 False
75 False
Name: Age, Length: 76, dtype: bool
#哑变量
#完整代码和更多课程请见http://edu.cda.cn敏捷算法
#data_drop = data_raw.drop(“edu_class”, axis = 1)
#完整代码和更多课程请见http://edu.cda.cn敏捷算法
#养成好习惯,为了等下的相关分析,哑变量转换后新生成一个Dataframe
相关分析
#相关分析
data.corr() # 相关系数矩阵


#热力图
import seaborn
seaborn.heatmap(data.corr())
data_raw[[“avg_exp”, “gender”, “Ownrent”, “Selfempl”, “edu_class”]].corr(method= ‘kendall’)

#散点图
import matplotlib.pyplot as plt
plt.scatter(data[“avg_exp”], data[“Income”])
Index([‘avg_exp’, ‘gender’, ‘Age’, ‘Income’, ‘Ownrent’, ‘Selfempl’,
‘dist_home_val’, ‘dist_avg_income’, ‘edu_class_1’, ‘edu_class_2’,
‘edu_class_3’, ‘edu_class_4’],
dtype=‘object’)
线性回归
#回归
#完整代码和更多课程请见http://edu.cda.cn敏捷算法
Index([‘avg_exp’, ‘gender’, ‘Age’, ‘Income’, ‘Ownrent’, ‘Selfempl’,
‘dist_home_val’, ‘dist_avg_income’, ‘edu_class’, ‘edu_class_1’,
‘edu_class_2’, ‘edu_class_3’, ‘edu_class_4’],
dtype=‘object’)
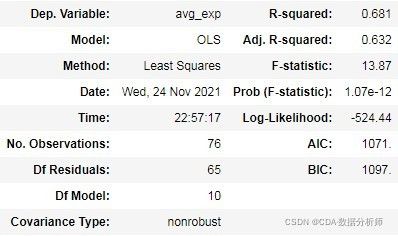
OLS Regression Results
[1] Standard Errors assume that the covariance matrix of the errors is correctly specified.
[2] The condition number is large, 1e+03. This might indicate that there are
strong multicollinearity or other numerical problems.
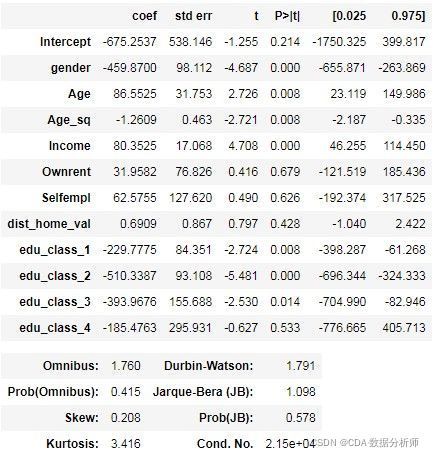
#哑变量只要有一个类别显著,就整体都显著。(学术界有争议)
#Durbin-Watson: 2.112 残差的序列相关性检验,约等于2,通过
#model.resid 可调出残差
#共线性VIF
#完整代码和更多课程请见http://edu.cda.cn敏捷算法
data_vif = data.iloc[: , 1:] # 去掉因变量
data_vif[“Inter”] = 1 # 注意,Python里的VIF值计算,必须手动添加常数列
#完整代码和更多课程请见http://edu.cda.cn敏捷算法
gender 2.307727540792289
Age 1.3963361188078867
Income 67.49672474307442
Ownrent 1.688327938688451
Selfempl 1.5374542896436476
dist_home_val 1.314125177827405
dist_avg_income 66.3651276803106
edu_class inf
edu_class_1 inf
edu_class_2 inf
edu_class_3 inf
edu_class_4 inf
Inter 62.79289703182464
C:\Users\CDA\anaconda3\lib\site-packages\statsmodels\stats\outliers_influence.py:193: RuntimeWarning: divide by zero encountered in double_scalars
vif = 1. / (1. - r_squared_i)
#去掉共线性过高的变量,重新跑回归
#完整代码和更多课程请见http://edu.cda.cn敏捷算法
model = model.fit()
model.summary()
OLS Regression Results
[1] Standard Errors assume that the covariance matrix of the errors is correctly specified.
#同方差
plt.scatter(model.predict(data), model.resid)

#正态概率图
#完整代码和更多课程请见http://edu.cda.cn敏捷算法

#可以尝试对因变量取ln,以改善正态性
#完整代码和更多课程请见http://edu.cda.cn敏捷算法
#正态概率图
from scipy import stats
fig = plt.figure()
res = stats.probplot(model_ln.resid, plot=plt)
plt.show()
#高次项,给年龄加平方
data[“Age_sq”] = data[“Age”] ** 2
#完整代码和更多课程请见http://edu.cda.cn敏捷算法
OLS Regression Results
[1] Standard Errors assume that the covariance matrix of the errors is correctly specified.
[2] The condition number is large, 2.15e+04. This might indicate that there are
strong multicollinearity or other numerical problems.
#交互项(若只做识别,不是必须加入)
data[“AgeGender”] = data[“Age”] * data[“gender”]
LR = “avg_exp ~ gender+Age+Age_sq+AgeGender+Income+Ownrent+Selfempl+dist_home_val+edu_class_1+edu_class_2+edu_class_3+edu_class_4”
model = ols(LR, data = data)
model = model.fit()
model.summary()
模型解释
通过以上回归分析,我们得到了如下结论
与用户信用卡月均支出显著相关的影响因素为:性别、年龄、收入、教育水平
男性比女性的信用卡月均支出高了231元
支出的巅峰年龄为中年
不同教育水平的支出排序为 研究生、大学、小学及以下、中学
变量选择
model.aic
1064.5623731285405
#向前法
def forward_select(data, response):
remaining = set(data.columns)
remaining.remove(response)
selected = []
current_score, best_new_score = float(‘inf’), float(‘inf’)
#完整代码和更多课程请见http://edu.cda.cn敏捷算法
candidates = [‘gender’,‘Age’,‘Income’,‘Ownrent’,‘Selfempl’,‘dist_home_val’,‘dist_avg_income’,‘edu_class’]
data_for_select = data[candidates]
model_sr = forward_select(data=data, response=‘avg_exp’)
model_sr.summary()
aic is 1097.5311739081399,continuing!
aic is 1087.952704175195,continuing!
aic is 1074.1179788054874,continuing!
aic is 1064.3200475471217,continuing!
aic is 1058.8139317381174,continuing!
aic is 1057.3674757236126,continuing!
aic is 1057.1504965444697,continuing!
forward selection over!
final formula is avg_exp ~ edu_class + dist_avg_income + gender + edu_class_2 + edu_class_1 + edu_class_3 + Income
OLS Regression Results
[1] Standard Errors assume that the covariance matrix of the errors is correctly specified.


