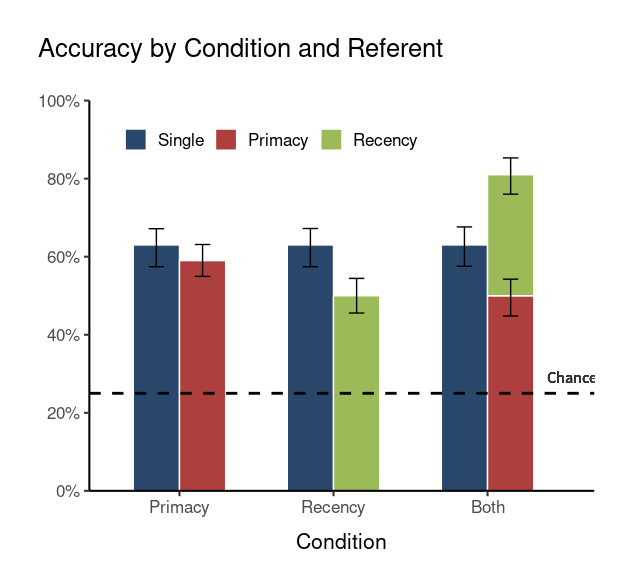
分享一个ggplot2画双误差线条形图的实际例子,喜欢的小伙伴可以关注我的公众号R语言数据分析指南,持续分享更多优质资源
可以将上述图看成以下2副图拼接而成
首先,我们先绘制蓝色的条形图和它们的误差线,然后绘制了绿色和红色的条形图和它们的误差线
library(tidyverse)
df <- tribble(
  ~Condition, ~Referent, ~Accuracy,
  "Primacy",  "Single",  0.63,
  "Primacy",  "Primacy", 0.59,
  "Recency",  "Single",  0.63,
  "Recency",  "Recency", 0.5,
  "Both",     "Single",  0.63,
  "Both",     "Primacy", 0.5,
  "Both",     "Recency", 0.31) %>%
  mutate(error_low = runif(7, .04, .06),
    error_high = runif(7, .04, .06),
    Condition_name = factor(Condition,
                            levels = c("Primacy", "Recency", "Both")),
    Condition = as.numeric(Condition_name),
    Referent = factor(Referent,
                      levels = c("Single", "Recency", "Primacy")),
    left = Referent == "Single",
    color = case_when(Referent == "Single" ~ "#29476B",
      Referent == "Primacy" ~ "#AD403D",Referent == "Recency" ~ "#9BBB58"))
ggplot(df,aes(x = Condition, y = Accuracy, fill = color)) +
  geom_col(
    data = filter(df, left),
    width = .3,
    color = "white",
    position = position_nudge(x = -.3),
  )+
  geom_errorbar(
    aes(ymin = Accuracy - error_low, ymax = Accuracy + error_high),
    data = filter(df, left),
    width = .1,
    position = position_nudge(x = -.3)
  )+
  geom_col(
    data = filter(df, !left),
    color = "white",
    width = .3,)+
  geom_errorbar(
    aes(y = y, ymin = y - error_low, ymax = y + error_high),
    data = filter(df, !left) %>%
      group_by(Condition) %>%
      mutate(y = accumulate(Accuracy, sum)),
    width = .1
  ) +
  geom_hline(
    aes(yintercept = .25),
    linetype = 2,
    size = 1,
  ) +
  geom_text(
    aes(x = 3.4, y = .29),
    label = "Chance",
    family = "Adelle",
    color = "grey20",
    inherit.aes = FALSE) +
  scale_fill_identity(
    labels = c("Single", "Primacy", "Recency"),
    guide = guide_legend(
      title = NULL,
      direction = "horizontal",
      override.aes = list(fill = c("#29476B", "#AD403D", "#9BBB58")))) +
  scale_x_continuous(
    breaks = 1:3 - .15,
    labels = levels(df$Condition_name),
    expand = expansion(c(.1, .05))) +
  scale_y_continuous(
    breaks = scales::pretty_breaks(6),
    labels = scales::percent_format(1),
    limits = 0:1,
    expand = expansion(0)) +
  labs(title = "Accuracy by Condition and Referent",
    y = NULL) +
  theme_classic(base_size = 16) +
  theme(plot.title.position = "plot",
    plot.title = element_text(margin = margin(0, 0, 1, 0, "cm")),
    legend.position = c(.35, .9),
    axis.title.x = element_text(margin = margin(t = .4, unit = "cm")),
    plot.margin = margin(1, 1, .7, 1, "cm"))


