Python日记(1)——求dy/dx
每天做一个Python小练习,顺便记录一些小技巧。
今天计算数值的时候,一直没搞懂怎么算一组x,y的变化率。于是做了一个求导数的方程。代码如下:
import numpy as np

x0 = np.arange(-1, 1, 0.2)
y0 = [-1.0000, -0.5120, -0.2160, -0.0640, -0.0080, 0, 0.0080, 0.2160, 0.5120, 1.0000]

for i in range(0, len(x0)):
    if i+1 == len(x0):
        break
    else:
        dx = round(round(x0[i + 1], 2) - round(x0[i], 2), 2)
        dy = round(round(y0[i+1], 4) - round(y0[i], 4), 4)
        d = round(dy / dx, 4)
        print(d)
因为python自带的range不支持步长值为浮点数,所以这里引用了numpy的arange,这也是今天刚学的小技巧。还有一点,python的浮点数计算不是很精确,所以这里引用了大量函数round()。
输出结果大概如下:
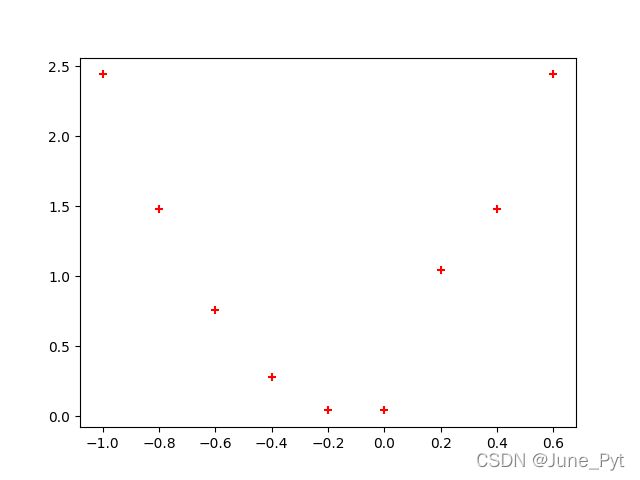
2.44
1.48
0.76
0.28
0.04
0.04
1.04
1.48
2.44
为了方便以后调用,便做成了函数,代码如下:
import numpy as np


def df(xs, ys):
    for i in range(0, len(xs)):
        if i+1 == len(xs):
            break
        else:
            dx = round(round(xs[i + 1], 2) - round(xs[i], 2), 2)
            dy = round(round(ys[i+1], 4) - round(ys[i], 4), 4)
            d = round(dy / dx, 4)
            print(d)


if __name__ == '__main__':
    x0 = np.arange(-1, 1, 0.2)
    y0 = [-1.0000, -0.5120, -0.2160, -0.0640, -0.0080, 0, 0.0080, 0.2160, 0.5120, 1.0000]
    df(x0, y0)
最后加上matplotlib画的散点图:
import numpy as np
from matplotlib import pyplot as plt


def df(xs, ys):
    d = list()
    for i in range(0, len(xs)):
        if i+1 == len(xs):
            break
        else:
            dx = round(round(xs[i + 1], 2) - round(xs[i], 2), 2)
            dy = round(round(ys[i+1], 4) - round(ys[i], 4), 4)
            dydx = round(dy / dx, 4)
            d.append(dydx)
    return d


if __name__ == '__main__':
    x0 = np.arange(-1, 1, 0.2)
    y0 = [-1.0000, -0.5120, -0.2160, -0.0640, -0.0080, 0, 0.0080, 0.2160, 0.5120, 1.0000]
    plt.scatter(x0[:-1], df(x0, y0), color='red', marker='+')
    plt.show()
