R语言dplyr包介绍 introduction to dplyr
使用dplyr包可以让我们更方便地操作R中的数据框
- 示例数据集
- 选择行:filter, slice函数
- 对行排序:arrange函数
- 选择列:select, rename函数
- 选择列:distinct函数
- 生成新列:mutate, transform, transmute函数
- 生成列数据的统计量:summarise函数
- 随机选取行:sample_n, sample_frac函数
- 分组操作:结合group_by函数
- 链接Chaining:利用操作符%>%
示例数据集 nycflights
library(nycflights13)
dim(flights)
#> [1] 336776     19
head(flights)
#> # A tibble: 6 x 19
#>    year month   day dep_time sched_dep_time dep_delay arr_time
#>
#> 1  2013     1     1      517            515         2      830
#> 2  2013     1     1      533            529         4      850
#> 3  2013     1     1      542            540         2      923
#> 4  2013     1     1      544            545        -1     1004
#> ... with 2 more rows, and 12 more variables: sched_arr_time ,
#>   arr_delay , carrier , flight , tailnum ,
#>   origin , dest , air_time , distance , hour ,
#>   minute , time_hour
filter, slice函数
filter(data,conditions)
根据基于列名的条件,选取符合的行,返回数据框
filter(flights, month == 1, day == 1)
#> # A tibble: 842 x 19
#> year month day dep_time sched_dep_time dep_delay arr_time
#>
#> 1 2013 1 1 517 515 2 830
#> 2 2013 1 1 533 529 4 850
#> 3 2013 1 1 542 540 2 923
#> 4 2013 1 1 544 545 -1 1004
#> ... with 838 more rows, and 12 more variables: sched_arr_time ,
#> arr_delay , carrier , flight , tailnum ,
#> origin , dest , air_time , distance , hour ,
#> minute , time_hour slice(data, …)
根据行的位置来选择行
slice(flights, 1:10)
#> # A tibble: 10 x 19
#>    year month   day dep_time sched_dep_time dep_delay arr_time
#>
#> 1  2013     1     1      517            515         2      830
#> 2  2013     1     1      533            529         4      850
#> 3  2013     1     1      542            540         2      923
#> 4  2013     1     1      544            545        -1     1004
#> ... with 6 more rows, and 12 more variables: sched_arr_time ,
#>   arr_delay , carrier , flight , tailnum ,
#>   origin , dest , air_time , distance , hour ,
#>   minute , time_hour
arrange函数
arrange(data, column names)
按照给定的column的顺序对行进行排列,然后返回排列后的数据框
如果要按照某列的降序来排列,采用desc(column names)函数
arrange(flights, year, month, day)
#> # A tibble: 336,776 x 19
#> year month day dep_time sched_dep_time dep_delay arr_time
#>
#> 1 2013 1 1 517 515 2 830
#> 2 2013 1 1 533 529 4 850
#> 3 2013 1 1 542 540 2 923
#> 4 2013 1 1 544 545 -1 1004
#> ... with 336,772 more rows, and 12 more variables: sched_arr_time ,
#> arr_delay , carrier , flight , tailnum ,
#> origin , dest , air_time , distance , hour ,
#> minute , time_hour select, rename函数
select(data, column names)
返回指定列组成的数据框
# Select columns by name
select(flights, year, month, day)
#> # A tibble: 336,776 x 3
#>    year month   day
#>
#> 1  2013     1     1
#> 2  2013     1     1
#> 3  2013     1     1
#> 4  2013     1     1
#> ... with 336,772 more rows
# Select all columns between year and day (inclusive)
select(flights, year:day)
#> # A tibble: 336,776 x 3
#>    year month   day
#>
#> 1  2013     1     1
#> 2  2013     1     1
#> 3  2013     1     1
#> 4  2013     1     1
#> ... with 336,772 more rows
# Select all columns except those from year to day (inclusive)
select(flights, -(year:day))
#> # A tibble: 336,776 x 16
#>   dep_time sched_dep_time dep_delay arr_time sched_arr_time arr_delay
#>
#> 1      517            515         2      830            819        11
#> 2      533            529         4      850            830        20
#> 3      542            540         2      923            850        33
#> 4      544            545        -1     1004           1022       -18
#> ... with 336,772 more rows, and 10 more variables: carrier ,
#>   flight , tailnum , origin , dest , air_time ,
#>   distance , hour , minute , time_hour
select(data, new names = column names)
给指定的列重命名,返回包含指定列的数据框
rename(data, new names = column names)
给指定的列重命名,返回包含所有列的数据框
select(flights, tail_num = tailnum)
#> # A tibble: 336,776 x 1
#>   tail_num
#>
#> 1   N14228
#> 2   N24211
#> 3   N619AA
#> 4   N804JB
#> ... with 336,772 more rows

rename(flights, tail_num = tailnum)
#> # A tibble: 336,776 x 19
#>    year month   day dep_time sched_dep_time dep_delay arr_time
#>
#> 1  2013     1     1      517            515         2      830
#> 2  2013     1     1      533            529         4      850
#> 3  2013     1     1      542            540         2      923
#> 4  2013     1     1      544            545        -1     1004
#> ... with 336,772 more rows, and 12 more variables: sched_arr_time ,
#>   arr_delay , carrier , flight , tail_num ,
#>   origin , dest , air_time , distance , hour ,
#>   minute , time_hour
distinct函数
distinct(data, column names)
返回由某几列组成的数据框,速度快
distinct(flights, tailnum)
#> # A tibble: 4,044 x 1
#>   tailnum
#>
#> 1  N14228
#> 2  N24211
#> 3  N619AA
#> 4  N804JB
#> ... with 4,040 more rows
distinct(flights, origin, dest)
#> # A tibble: 224 x 2
#>   origin  dest
#>
#> 1    EWR   IAH
#> 2    LGA   IAH
#> 3    JFK   MIA
#> 4    JFK   BQN
#> ... with 220 more rows
mutate, transform, transmute函数
mutate(data, expressions of new columns)
通过原有的列的计算得到新的列,将新的列与原来的数据框合并,返回新的数据框
mutate(flights,
gain = arr_delay - dep_delay,
speed = distance / air_time * 60)
#> # A tibble: 336,776 x 21
#> year month day dep_time sched_dep_time dep_delay arr_time
#>
#> 1 2013 1 1 517 515 2 830
#> 2 2013 1 1 533 529 4 850
#> 3 2013 1 1 542 540 2 923
#> 4 2013 1 1 544 545 -1 1004
#> ... with 336,772 more rows, and 14 more variables: sched_arr_time ,
#> arr_delay , carrier , flight , tailnum ,
#> origin , dest , air_time , distance , hour ,
#> minute , time_hour transform(data, expression of new columns)
与mutate功能相同,但不能通过刚新生成的列来生成更新的列
mutate(flights,
gain = arr_delay - dep_delay,
gain_per_hour = gain / (air_time / 60)
)
#> # A tibble: 336,776 x 21
#> year month day dep_time sched_dep_time dep_delay arr_time
#>
#> 1 2013 1 1 517 515 2 830
#> 2 2013 1 1 533 529 4 850
#> 3 2013 1 1 542 540 2 923
#> 4 2013 1 1 544 545 -1 1004
#> ... with 336,772 more rows, and 14 more variables: sched_arr_time ,
#> arr_delay , carrier , flight , tailnum ,
#> origin , dest , air_time , distance , hour ,
#> minute , time_hour transmute(data, expressions of new columns)
通过原有的列的计算得到新的列,返回仅包含新列的数据框
transmute(flights,
  gain = arr_delay - dep_delay,
  gain_per_hour = gain / (air_time / 60)
)
#> # A tibble: 336,776 x 2
#>    gain gain_per_hour
#>
#> 1     9      2.378855
#> 2    16      4.229075
#> 3    31     11.625000
#> 4   -17     -5.573770
#> ... with 336,772 more rows
summarise函数
summarise(data, expressions)
epressions是多个多元函数f(x1,x2,….xn)赋值给变量的表达式,每个表达式中,某一列的数据传入多元函数得到结果,最终返回由这些表达式得到的结果组成的数据框
summarise(flights,
  delay = mean(dep_delay, na.rm = TRUE))
#> # A tibble: 1 x 1
#>      delay
#>
#> 1 12.63907
sample_n, sample_frac函数
sample_n(data, size, replace = FALSE, weight = NULL, .env = parent.frame())
sample_frac(data, size = 1, replace = FALSE, weight = NULL, .env = parent.frame())
随机挑选行,sample_frac是通过抽取总体的某一百分比的样本来确定样本个数
sample_n(flights, 10)
#> # A tibble: 10 x 19
#> year month day dep_time sched_dep_time dep_delay arr_time
#>
#> 1 2013 7 8 2205 2019 106 103
#> 2 2013 9 12 1602 1545 17 NA
#> 3 2013 11 4 1459 1459 0 1642
#> 4 2013 10 25 1354 1350 4 1534
#> ... with 6 more rows, and 12 more variables: sched_arr_time ,
#> arr_delay , carrier , flight , tailnum ,
#> origin , dest , air_time , distance , hour ,
#> minute , time_hour group_by函数
group_by(.data, …, add = FALSE)
group_by_(.data, …, .dots, add = FALSE)
返回一个分组后的数据框
| 参数 | |
|---|---|
| .data | 一个tbl类型数据 |
| … | 用于分组的列。可以传入某一确定的列,有时可以传入某个函数 |
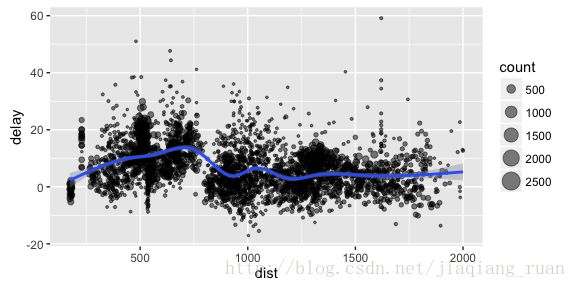
按照tailnum对总的数据分类,再计算某几列的统计量,得到各个类别下各个统计量的值
by_tailnum <- group_by(flights, tailnum)
    delay <- summarise(by_tailnum,
      count = n(),
      dist = mean(distance, na.rm = TRUE),
      delay = mean(arr_delay, na.rm = TRUE))
    delay <- filter(delay, count > 20, dist < 2000)

# Interestingly, the average delay is only slightly related to the
# average distance flown by a plane.
ggplot(delay, aes(dist, delay)) +
  geom_point(aes(size = count), alpha = 1/2) +
  geom_smooth() +
  scale_size_area()
操作符%>%
当嵌套使用group_by时,可以用%>%进行简化书写
x %>% f(y) 等价于 f(x, y)
以下三种书写方式等价:
1.生成中间变量
a1 <- group_by(flights, year, month, day)
a2 <- select(a1, arr_delay, dep_delay)
a3 <- summarise(a2,
  arr = mean(arr_delay, na.rm = TRUE),
  dep = mean(dep_delay, na.rm = TRUE))
a4 <- filter(a3, arr > 30 | dep > 30)
2.嵌套写法
filter(
summarise(
select(
  group_by(flights, year, month, day),
  arr_delay, dep_delay
),
arr = mean(arr_delay, na.rm = TRUE),
dep = mean(dep_delay, na.rm = TRUE)
),
arr > 30 | dep > 30
)
#> Adding missing grouping variables: `year`, `month`, `day`
#> Source: local data frame [49 x 5]
#> Groups: year, month [11]
#>
#> # A tibble: 49 x 5
#>    year month   day      arr      dep
#>
#> 1  2013     1    16 34.24736 24.61287
#> 2  2013     1    31 32.60285 28.65836
#> 3  2013     2    11 36.29009 39.07360
#> 4  2013     2    27 31.25249 37.76327
#> ... with 45 more rows
3.%>%
flights %>%
  group_by(year, month, day) %>%
  select(arr_delay, dep_delay) %>%
  summarise(
    arr = mean(arr_delay, na.rm = TRUE),
    dep = mean(dep_delay, na.rm = TRUE)
  ) %>%
filter(arr > 30 | dep > 30)
https://cran.rstudio.com/web/packages/dplyr/vignettes/introduction.html