2. matplotlib.pyplot.plot函数
《玩转Matplotlib数据绘图库》视频课程
《玩转Matplotlib数据绘图库》视频课程链接:https://edu.csdn.net/course/detail/28720
matplotlib.pyplot.plot函数
回顾第一个例子
在第一个例子中
%matplotlib inline
import matplotlib.pyplot as plt
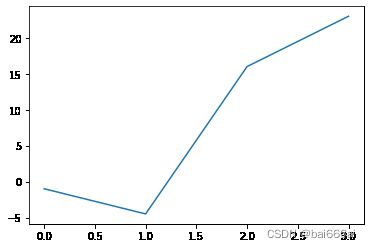
plt.plot([-1, -4.5, 16, 23])
plt.show()
即使为Y值提供的是离散数据,我们看到的是一个连续的图。
格式字符串
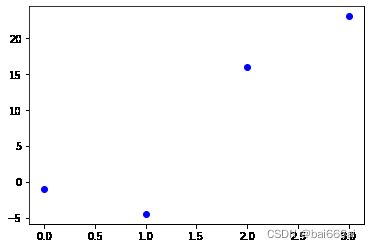
通过向plot函数调用添加一个格式字符串,可以创建具有离散值的图形,
在示例中数据点为蓝色圆圈标记。 格式字符串定义了离散点如何呈现的方式。
import matplotlib.pyplot as plt
plt.plot([-1, -4.5, 16, 23], "ob")
plt.show()
我们将“ob”用作格式参数。 它由两个字符组成。
第一个字符定义线型风格或离散值样式(即标记,markers),而第二个字符选择图形的颜色。 这两个字符的顺序可以颠倒,即也可以将其写为“bo”。 如果format参数没有给出,则将“b-”用作默认值,即蓝色实线。
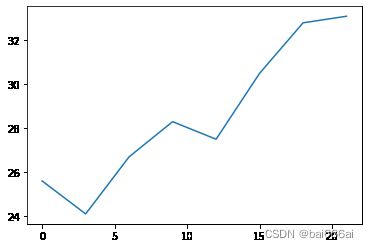
可以将X值添加到绘图函数中。 在下面的示例中,传递3的倍数(包括0到21)以进行绘制:
%matplotlib inline
import matplotlib.pyplot as plt
# our X values:
days = list(range(0, 22, 3))
print(days)
# our Y values:
celsius_values = [25.6, 24.1, 26.7, 28.3, 27.5, 30.5, 32.8, 33.1]
plt.plot(days, celsius_values)
plt.show()
[0, 3, 6, 9, 12, 15, 18, 21]
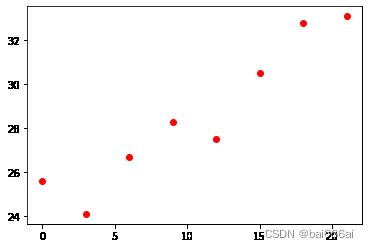
绘制离散值:
plt.plot(days, celsius_values, 'ro')
plt.show()
plot函数
plt.plot(x, y, format_string, **kwargs)
x: X轴数据,列表或数组,可选y: Y轴数据,列表或数组format_string: 控制曲线的格式字符串,可选**kwargs: 第二组或更多(x,y,format_string)
当绘制多条曲线时,各条曲线的x不能省略
format_string分为线型风格字符、标记字符和颜色字符:
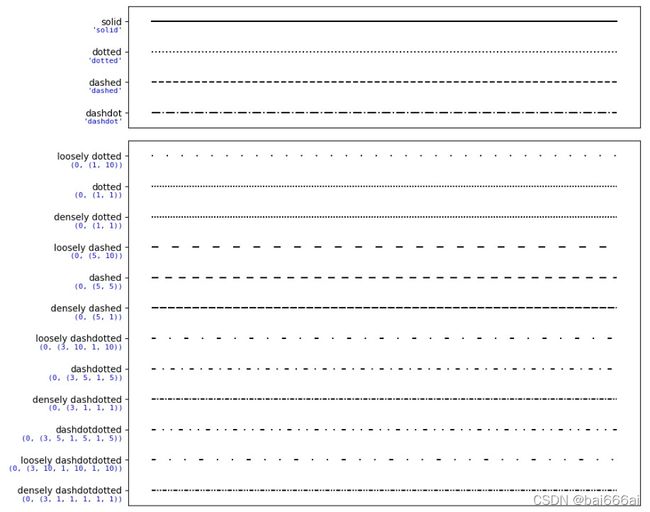
线型风格字符
| 线型风格字符 | 说明 |
|---|---|
| ‘-’ | solid line style (实线) |
| ‘–’ | dashed line style (虚线) |
| ‘-.’ | dash-dot line style (点划线) |
| ‘:’ | dotted line style (点线) |
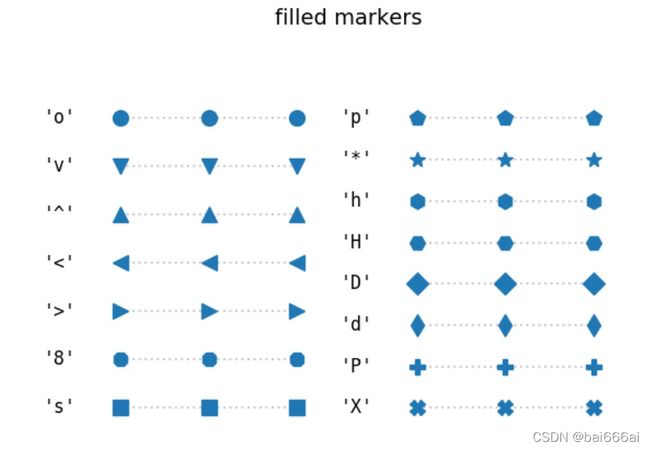
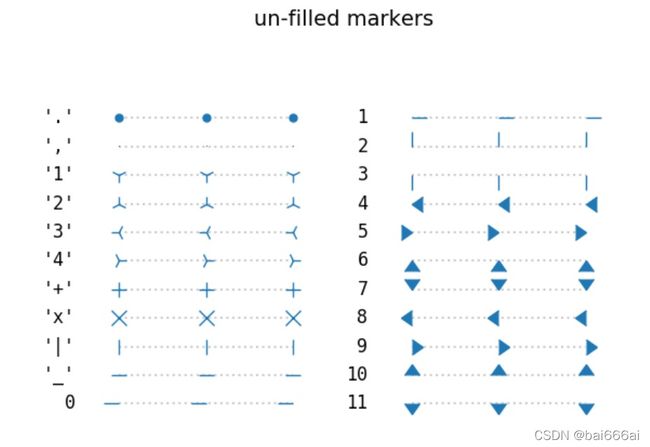
标记(marker)字符
| 标记字符 | 说明 |
|---|---|
| ‘.’ | point marker |
| ‘,’ | pixel marker |
| ‘o’ | circle marker |
| ‘v’ | triangle_down marker |
| ‘^’ | triangle_up marker |
| ‘<’ | triangle_left marker |
| ‘>’ | triangle_right marker |
| ‘1’ | tri_down marker |
| ‘2’ | tri_up marker |
| ‘3’ | tri_left marker |
| ‘4’ | tri_right marker |
| ‘s’ | square marker |
| ‘p’ | pentagon marker |
| ‘*’ | star marker |
| ‘h’ | hexagon1 marker |
| ‘H’ | hexagon2 marker |
| ‘+’ | plus marker |
| ‘x’ | x marker |
| ‘D’ | diamond marker |
| ‘d’ | thin_diamond marker |
| ‘|’ | vline marker |
颜色字符:
| 颜色字符 | 说明 |
|---|---|
| ‘b’ | blue (蓝色) |
| ‘g’ | green (绿色) |
| ‘r’ | red (红色) |
| ‘c’ | cyan (青绿色) |
| ‘m’ | magenta (洋红色) |
| ‘y’ | yellow (黄色) |
| ‘k’ | black (黑色) |
| ‘w’ | 白色 |
| ‘#008000’ | RGB某颜色 |
| ‘0.8’ | 灰度值字符串 |
风格字符、标记字符和颜色字符可以组合使用
plt.plot([1, 2, 3], [1, 2, 3], 'go--', label='line 1', linewidth=3)
plt.plot([1, 2, 3], [1, 4, 9], 'rs', label='line 2')
plt.show()
