3. Matplotlib设置轴标签和范围
《玩转Matplotlib数据绘图库》视频课程
《玩转Matplotlib数据绘图库》视频课程链接:https://edu.csdn.net/course/detail/28720
设置轴标签和范围
轴的标签 (Labels on Axes)
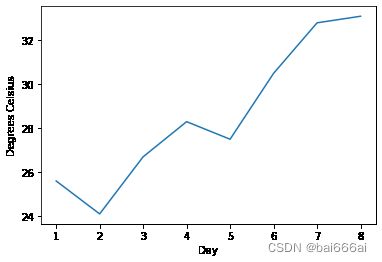
我们可以向轴添加标签来改善图形的外观。 这可以通过pyplot的ylabel和xlabel函数来完成。
%matplotlib inline
import matplotlib.pyplot as plt
days = list(range(1,9))
celsius_values = [25.6, 24.1, 26.7, 28.3, 27.5, 30.5, 32.8, 33.1]
plt.plot(days, celsius_values)
plt.xlabel('Day')
plt.ylabel('Degrees Celsius')
plt.show()
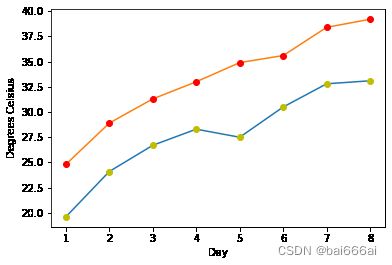
可以在绘图函数plot中指定任意数量的x,y,fmt组。 在以下示例中,我们使用两个不同的y值列表:
import matplotlib.pyplot as plt
days = list(range(1,9))
celsius_min = [19.6, 24.1, 26.7, 28.3, 27.5, 30.5, 32.8, 33.1]
celsius_max = [24.8, 28.9, 31.3, 33.0, 34.9, 35.6, 38.4, 39.2]
plt.xlabel('Day')
plt.ylabel('Degrees Celsius')
plt.plot(days, celsius_min,
         days, celsius_min, "oy",
         days, celsius_max,
         days, celsius_max, "or")
plt.show()
定义轴的范围
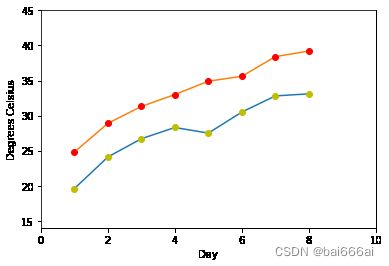
我们还可以使用函数axis查看和定义轴的范围。 如果不带参数调用它,则返回当前轴的limits:
days = list(range(1,9))
celsius_min = [19.6, 24.1, 26.7, 28.3, 27.5, 30.5, 32.8, 33.1]
celsius_max = [24.8, 28.9, 31.3, 33.0, 34.9, 35.6, 38.4, 39.2]
plt.xlabel('Day')
plt.ylabel('Degrees Celsius')
plt.plot(days, celsius_min,
         days, celsius_min, "oy",
         days, celsius_max,
         days, celsius_max, "or")
print("The current limits for the axes are:")
print(plt.axis())
print("We set the axes to the following values:")
xmin, xmax, ymin, ymax = 0, 10, 14, 45
print(xmin, xmax, ymin, ymax)
plt.axis([xmin, xmax, ymin, ymax])
plt.show()
The current limits for the axes are:
(0.6499999999999999, 8.35, 18.62, 40.18)
We set the axes to the following values:
0 10 14 45
import matplotlib.pyplot as plt
days = list(range(1,9))
celsius_min = [19.6, 24.1, 26.7, 28.3, 27.5, 30.5, 32.8, 33.1]
celsius_max = [24.8, 28.9, 31.3, 33.0, 34.9, 35.6, 38.4, 39.2]
plt.xlabel('Day')
plt.ylabel('Degrees Celsius')
plt.plot(days, celsius_min,
         days, celsius_min, "oy",
         days, celsius_max,
         days, celsius_max, "or")
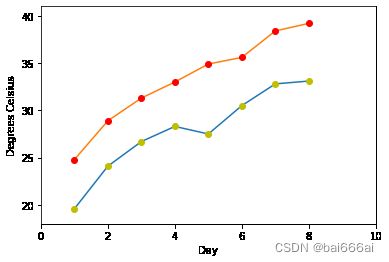
plt.axis([0, 10, 18, 41])
plt.show()
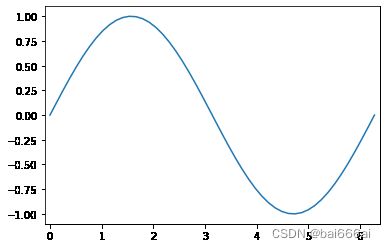
使用linspace定义X值 (“linspace” to Define X Values)
我们在以下示例中使用Numpy函数linspace。 linspace可用于在指定间隔内创建均匀分布的数字。
import numpy as np
import matplotlib.pyplot as plt
X = np.linspace(0, 2 * np.pi, 50, endpoint=True)
F = np.sin(X)
plt.plot(X,F)
startx, endx = -0.1, 2*np.pi + 0.1
starty, endy = -1.1, 1.1
plt.axis([startx, endx, starty, endy])
plt.show()
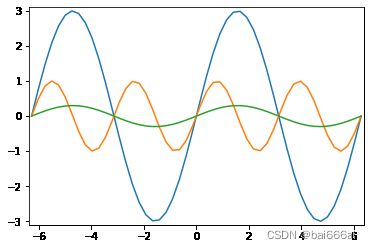
import matplotlib.pyplot as plt
X = np.linspace(-2 * np.pi, 2 * np.pi, 50, endpoint=True)
F1 = 3 * np.sin(X)
F2 = np.sin(2*X)
F3 = 0.3 * np.sin(X)
startx, endx = -2 * np.pi - 0.1, 2*np.pi + 0.1
starty, endy = -3.1, 3.1
plt.axis([startx, endx, starty, endy])
plt.plot(X,F1)
plt.plot(X,F2)
plt.plot(X,F3)
plt.show()
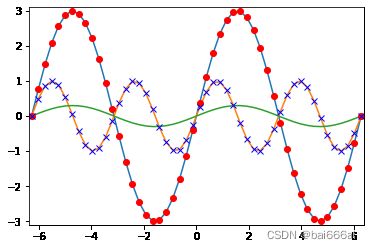
下一个例子中将在上图的基础上添加两个具有离散点的图:
import matplotlib.pyplot as plt
X = np.linspace(-2 * np.pi, 2 * np.pi, 50, endpoint=True)
F1 = 3 * np.sin(X)
F2 = np.sin(2*X)
F3 = 0.3 * np.sin(X)
startx, endx = -2 * np.pi - 0.1, 2*np.pi + 0.1
starty, endy = -3.1, 3.1
plt.axis([startx, endx, starty, endy])
plt.plot(X,F1)
plt.plot(X,F2)
plt.plot(X,F3)
plt.plot(X, F1, 'ro')
plt.plot(X, F2, 'bx')
plt.show()
