可视化常见绘图(五)散点图
可视化常见绘图(五)散点图
一.散点图简介
散点图也叫 X-Y 图,它将所有的数据以点的形式展现在直角坐标系上,以显示变量之间的相互影响程度,点的位置由变量的数值决定。
通过观察散点图上数据点的分布情况,我们可以推断出变量间的相关性。如果变量之间不存在相互关系,那么在散点图上就会表现为随机分布的离散的点,如果存在某种相关性,那么大部分的数据点就会相对密集并以某种趋势呈现。数据的相关关系主要分为:
- 正相关(两个变量值同时增长)。
- 负相关(一个变量值增加另一个变量值下降)。
- 不相关。
- 线性相关。
- 指数相关。
散点图经常与回归线结合使用,归纳分析现有数据以进行预测分析。
对于那些变量之间存在密切关系,但是这些关系又不像数学公式和物理公式那样能够精确表达的,散点图是一种很好的图形工具。但是在分析过程中需要注意,这两个变量之间的相关性并不等同于确定的因果关系,也可能需要考虑其他的影响因素。
二.散点图的组成
一个标准的散点图至少包括以下几个部分:
- 纵轴:表示其中一个变量的值
- 横轴:表示其中一个变量的值
- 点:(X,Y)
- 回归线:最准确地贯穿所有点的线
三.应用场景
适合数据:两个连续数据字段的数据。
主要功能:观察数据的分布。
适用数据条数:无限制。
备注:为了更好的观察数据分布,需要设置数据点的透明度或者是颜色。
适合场景:
- 显示和比较数值,不光可以显示趋势,还能显示数据集群的形状,以及在数据云团中各数据点的关系。
不适合场景:
- 显示各个分类数据的比例。
四.实现
在matplotlib中使用scatter函数实现散点图,函数介绍如下:
scatter(x, y, s=None, c=None, marker=None, cmap=None, norm=None,vmin=None, vmax=None, alpha=None, linewidths=None, *,edgecolors=None, plotnonfinite=False, data=None, **kwargs)
参数1:x,y:指定数据散点的坐标。
参数2:s:数值型,指定散点的大小。
参数3:c:数组或类数组型,指定散点的颜色。
参数4:marker:限定字符串,指定散点的标记类型(默认为:‘o’)。
参数5:cmap:指定所选用的colormap。
参数6:norm:未知。
参数7、8:min、vmax和norm配合使用用来归一化数据。
参数9:alpha:浮点型,指定散点的透明度。
参数10:linewidths:整数型,指定散点边缘的线宽;如果marker为None,则使用verts的值构建散点标记
参数11:verts:未知。
参数12:edgecolors:数组或类数组型,指定散点边缘颜色,会循环显示。
参数13:plotnonfinite:布尔型,结合 set_bad使用,指定是否是非限定式画点。
参数14:**kwargs:接受的关键字参数传递给Collection实例。
返回值:关联的PathCollection实例。
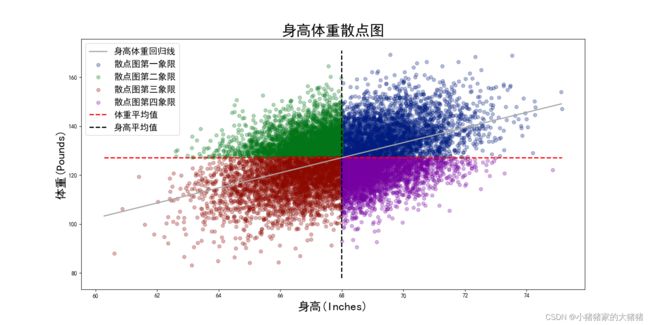
使用以SOCR-HeightWeight.csv数据集为例,该数据集一共记录了25000 个对象的身高体重,以身高为横轴,以体重为纵轴,查看两个变量之间的关系,完整代码如下:
import matplotlib.pyplot as plt

from sklearn.linear_model import LinearRegression

import numpy as np

import pandas as pd

plt.rcParams['font.sans-serif'] = ['SimHei']  # 设置支持中文
plt.rcParams['axes.unicode_minus'] = False  # 设置-号
plt.style.use('seaborn-dark-palette')

df = pd.read_csv("SOCR-HeightWeight.csv", index_col=0)
height = df["Height(Inches)"].values.reshape(-1, 1)
weight = df["Weight(Pounds)"].values.reshape(-1, 1)

model = LinearRegression()
model.fit(height, weight)
coef = model.coef_[0]
intercept = model.intercept_[0]

height_avg = np.average(height)
weight_avg = np.average(weight)

quadrant1 = df[(df["Height(Inches)"] >= height_avg) & (df["Weight(Pounds)"] >= weight_avg)]
quadrant1_height = quadrant1["Height(Inches)"][:3000]
quadrant1_weight = quadrant1["Weight(Pounds)"][:3000]
plt.scatter(quadrant1_height, quadrant1_weight, alpha=0.3, label="散点图第一象限")

quadrant2 = df[(df["Height(Inches)"] <= height_avg) & (df["Weight(Pounds)"] >= weight_avg)]
quadrant2_height = quadrant2["Height(Inches)"][:3000]
quadrant2_weight = quadrant2["Weight(Pounds)"][:3000]
plt.scatter(quadrant2_height, quadrant2_weight, alpha=0.3, label="散点图第二象限")

quadrant3 = df[(df["Height(Inches)"] <= height_avg) & (df["Weight(Pounds)"] <= weight_avg)]
quadrant3_height = quadrant3["Height(Inches)"][:3000]
quadrant3_weight = quadrant3["Weight(Pounds)"][:3000]
plt.scatter(quadrant3_height, quadrant3_weight, alpha=0.3, label="散点图第三象限")

quadrant4 = df[(df["Height(Inches)"] >= height_avg) & (df["Weight(Pounds)"] <= weight_avg)]
quadrant4_height = quadrant4["Height(Inches)"][:3000]
quadrant4_weight = quadrant4["Weight(Pounds)"][:3000]
plt.scatter(quadrant4_height, quadrant4_weight, alpha=0.3, label="散点图第四象限")

# 画平均值
plt.hlines(weight_avg, min(height), max(height), ls="--", color='r', lw=2, label='体重平均值')
plt.vlines(height_avg, min(weight), max(weight), ls='--', color='k', lw=2, label='身高平均值')
x = np.arange(min(height), max(height), 0.05)
y = coef * x + intercept
plt.plot(x, y, lw=2, color="darkgray", label="身高体重回归线")
plt.title("身高体重散点图", fontsize=25, fontweight="bold")
plt.xlabel("身高(Inches)", fontsize=20)
plt.ylabel("体重(Pounds)", fontsize=20)
plt.legend(fontsize=15)
plt.show()
五.参考
- 堆叠图介绍
- 折线图
- 面积图
- 柱状图
