数据可视化Matplotlib使用4-双Y轴坐标系
绘制双Y轴坐标系
首先要清楚双Y轴坐标系与一图多线的区别, 虽然双Y轴坐标系是有两条折线,
- 举个栗子:
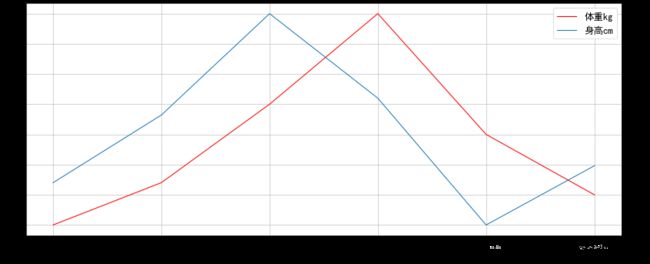
- 假如有一个班级的体重和身高数据, 数据里面有姓名、身高、体重, 需求就是把身高和体重分别画出两个折线图, 这时是不是就可以姓名为X轴, 身高和体重各自为一个Y轴, 这不就成了一个双Y轴坐标系啦.
准备数据
import pandas as pd

dict={
    '体重kg': [45, 52, 65, 80, 60, 50],
    '身高cm': [160, 168, 180, 170, 155, 162]}
df=pd.DataFrame(dict, index=['王小红', '张小梅', '李大刀', '赵大厨', '宋大宝', '真好看' ])
df.head(6)
| 体重kg | 身高cm | |
|---|---|---|
| 王小红 | 45 | 160 |
| 张小梅 | 52 | 168 |
| 李大刀 | 65 | 180 |
| 赵大厨 | 80 | 170 |
| 宋大宝 | 60 | 155 |
| 真好看 | 50 | 162 |
import pandas as pd
from matplotlib import pyplot as plt
from matplotlib import font_manager
my_font = font_manager.FontProperties(fname='E:/demo/wy163/simhei.ttf',size=18)

# X =
X = df.index.tolist()
Y1 = df["体重kg"].values.tolist()
Y2 = df["身高cm"].values.tolist()
# 返回一个 Figure 实例(画布实例)
fig = plt.figure(figsize=(20,8),dpi=50)
# 使用画布Figure实例返回第一个Axes实例对象(也就一个)
ax = fig.add_subplot(111)

# 使用 Axes对象画第一条线
lin1 = ax.plot(X, Y1, label='体重kg',color='red')
ax.legend(prop=my_font,loc=0)
ax.set_ylabel("体重kg",fontproperties=my_font) # Y1 轴标题
ax.set_xlabel("同学名字",fontproperties=my_font) # X轴共享设置一次

plt.xticks(X, fontproperties=my_font) # 自定义x轴标注

# ax.twinx()是在 ax 的坐标轴内创建一个共享X轴的的坐标轴实例
ax2 = ax.twinx()
lin2 = ax2.plot(X, Y2,label='身高cm')
ax2.legend(prop=my_font)
ax2.set_ylabel("身高cm",fontproperties=my_font) # Y2 轴标题

# 合并图例, 不合并的话只会显示第二个图例, (被覆盖)
lns = lin1+lin2
labs = [l.get_label() for l in lns]
ax2.legend(lns, labs, prop=my_font)

# 绘制网格
ax.grid()
# 显示图像
plt.show()
add_subplot()
add_subplot(111)或者add_subplot(1,1,1)- 返回一个Axes实例
- 参数一: 子图总行数
- 参数二: 子图的总列数
- 参数三: 子图位置
- 这个参数跟
subplot()的参数是差不多的 - 例
add_subplot(221)表示吧画布分为2行2列后返回第一个Axes实例 - 例
add_subplot(3, 4, 11)表示吧画布分为3行4列后返回第11个Axes实例,当总的Axes数量大于10个的时候, 取10+位置的Axes实例时, 要使用这种方法
twinx()
- 使用 Axes 坐标轴实例调用 twinx() 函数, 实现两个Y轴共享一个X轴的效果
ax2 = ax.twinx()- ax.twinx()是在ax的坐标轴内创建一个共享X轴的的坐标轴实例
- 所以我们可以在ax2的坐标轴实例中绘制每日成交量的折线图
在我自定义
X轴的标注时, 调用plt.xticks()方法的时候要在twinx()之前, 就是共享X轴前就把X轴的问题(中文标注)解决
图例合并
lns = lin1+lin2
labs = [l.get_label() for l in lns]
ax.legend(lns, labs, prop=my_font)
- lin1和lin2分别是两个绘图方法plot()的返回值,即折线对象。需要注意的是,lin1和lin2的类型是list
- legend()方法可以指定图例中有哪些值,第一个参数lns表示将图中的多个线以列表的形势传进去,第二个参数labs表示将图例的名字以列表的形势传进去