MATLAB学习笔记 皮尔逊相关系数和模板匹配
一、皮尔逊相关系数
在统计学中,皮尔逊相关系数( Pearson correlation coefficient),又称皮尔逊积矩相关系数(Pearson product-moment correlation coefficient,简称 PPMCC或PCCs),是用于度量两个变量X和Y之间的相关(线性相关),其值介于-1与1之间。

计算步骤参考下面文章的第七节相关性
机器学习笔记 - 数据和统计常用术语_bashendixie5的博客-CSDN博客从以下角度描述了数据及其统计方法。1、数据的类型定性与定量、离散或连续2、集中趋势的度量均值、中位数、众数、异常值、几何平均值、调和平均值、加权平均值。3、数据的采样随机采样、系统采样,分层采样,聚类样本等。4、数据分布的度量分位数、平均偏差、标准差和方差5、数据的比较单变量和双变量、离群值、相关性概念及其公式https://blog.csdn.net/bashendixie5/article/details/123613591
二、matlab计算相关性
1、示例1
按公式计算,A 和 B 高度相关。相关系数为1。
A= [1 4 7; 2 5 8; 3 6 9]
B = A*2

%Find the average of the matrix A
meanA = mean2(A);

%Find the average of the matrix B
meanB = mean2(B);

%Subtract the average value from matrix A
Asub = A-meanA;

%Subtract the average value from matrix B
Bsub = B-meanB;

%Covariance of matrix A and matrix B
covAB = mean2(Asub.*Bsub);

%Find the standard deviation of the matrix A
stdA = std(A(:),1);

%Find the standard deviation of the matrix B
stdB = std(B(:),1);

%Find the correlation Cofficient
Rho = covAB./(stdA*stdB)
2、示例2
使用corr2函数,C和D相关系数为 -1。
C= [1 4 7; 2 5 8; 3 6 9]
D = [9 6 3;8 5 2; 7 4 1];

Rho = corr2(C,D)
三、模板匹配示例
 原图
原图
 模板
模板
1、使用normxcorr2函数
参考代码
%Read an Image A(Template)
A1 = imread('benten.jpg');

%Read the Target Image
B1 = imread('watch.jpg');

A = A1(:,:,1);
B = B1(:,:,1);


normx_corrmap=normxcorr2(B(:,:,1),A(:,:,1));

maxptx = max(normx_corrmap(:));
[x1,y1]=find(normx_corrmap==maxptx);
figure,
imagesc(A1(x1-size(B,1):x1,y1-size(B,2):y1,:));axis image
运行结果如下

2、使用corr2函数
参考代码
%Read an Image A(Template)
    A1 = imread('图片/benten.jpg');
    %Read the Target Image
    B1 = imread('图片/watch.jpg');
    A = A1(:,:,1);
    B = B1(:,:,1);
    corr_map = zeros([size(A,1),size(A,2)]);
    for i = 1:size(A,1)-size(B,1)
        for j = 1:size(A,2)-size(B,2)
            %Construct the correlation map
            corr_map(i,j) = corr2(A(i:i+size(B,1)-1,j:j+size(B,2)-1),B);
        end
    end

    figure,imagesc(corr_map);colorbar;
    %Find the maximum value
    maxpt = max(corr_map(:));
    [x,y]=find(corr_map==maxpt);

    %Display the image from the template
    figure,imagesc(B1);title('Target Image');colormap(gray);axis image

    grayA = rgb2gray(A1);
    Res   = A;
    Res(:,:,1)=grayA;
    Res(:,:,2)=grayA;
    Res(:,:,3)=grayA;

    Res(x:x+size(B,1)-1,y:y+size(B,2)-1,:)=A1(x:x+size(B,1)-1,y:y+size(B,2)-1,:);

    figure,imagesc(Res);
运行结果如下
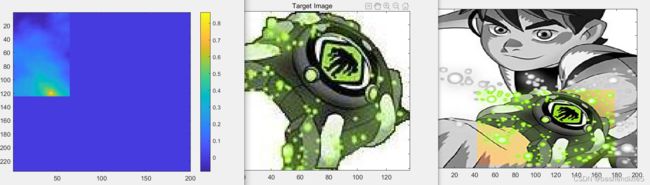 左:相关图(x,y)。右:匹配的位置
3、频域模板匹配
基于傅里叶域中的归一化互相关。也称为相位相关。这里使用的两张图片是同一场景的不同快照。Image1.jpg用作模板图像,Image2.jpg的子图像用作目标图像。目标图像用零填充以匹配模板图像的大小。经过傅里叶变换后,模板信号与目标信号的共轭相乘并归一化。然后应用逆傅里叶,提取最大值对应的像素位置。
%Read two images of same scene
A = imread('Image1.jpg');
B = imread('Image2.jpg');
figure,subplot(2,1,1);imagesc(A);title('Image 1');axis image
subplot(2,1,2);imagesc(B);title('Image 2');axis image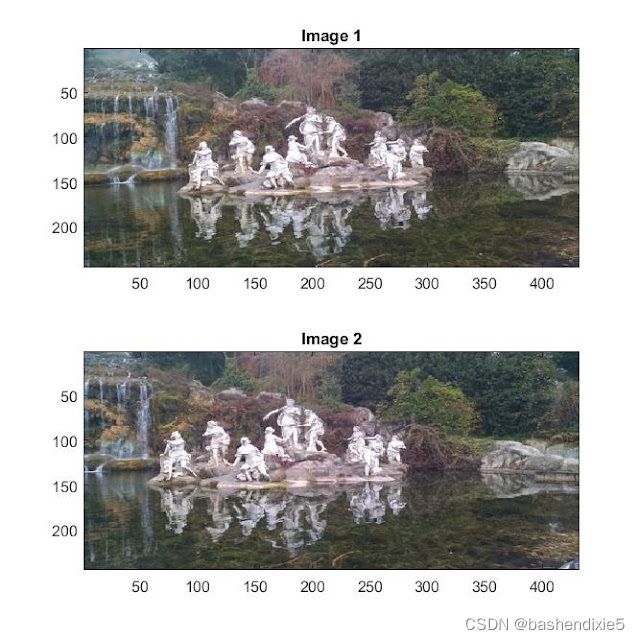 同一场景的不同快照
从图像矩阵B中裁剪一部分
B = imcrop(B,[58.5 49.5 226 102]);
figure,imagesc(B);title('sub Image - Image 2');axis image
应用傅里叶变换和逆变换
%Pad the image matrix B with zeros
B1 = zeros([size(A,1),size(A,2)]);
B1(1:size(B,1),1:size(B,2))=B(:,:,1);

%Apply Fourier Transform
Signal1 = fftshift(fft2(A(:,:,1)));
Signal2 = fftshift(fft2(B1));

%Mulitply Signal1 with the conjugate of Signal2
R = Signal1 .*conj(Signal2);

%Normalize the result
Ph = R./abs(R);


%Apply inverse fourier transform
IFT = ifft2(fftshift(Ph));

figure,imagesc((abs((IFT))));colormap(gray);
计算得到相关图
查找最大值的像素位置,并从image1和image2中截取
%Find the maximum value
maxpt = max(real(IFT(:)));

%Find the pixel position of the maximum value
[x,y]= find(real(IFT)==maxpt);

figure,subplot(1,2,1);imagesc(A(x:x+size(B,1),y:y+size(B,2),:));axis image
subplot(1,2,2);imagesc(B);axis image
结果如下
