Matplotlib的基础使用
Matplotlib的基础使用
Matplotlib的两种绘图方式
1、%matplotlib inline
%matplotlib inline
import numpy as np
#必须要在首行%matplotlib inline
x = np.linspace(0, 2*np.pi, 100)  #0-2π,取100个数
y1 = np.sin(x)
plt.plot(x, y1)
y2 = np.cos(x)
plt.plot(x, y2)
plt.plot(x, y1)
plt.plot(x, y2)
#使用同一个未知数x,则两个函数绘于1图
fig = plt.figure()
ax = fig.add_axes([0.1, 0.1, 0.8, 0.8])
x = np.linspace(0, 2*np.pi, 100)
ax.plot(x, np.sin(x))
#1、创建figure对象
#2、添加坐标轴fig.add_axes([0.1, 0.1, 0.8, 0.8]),参数是坐标轴的位置,分别是左,下,右,上
#设置网格
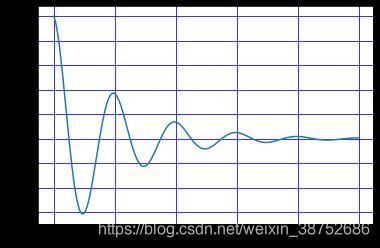
x = np.arange(0, 5, 0.02)
y = np.exp(-x) * np.cos(2*np.pi*x)
plt.plot(x, y)
plt.grid(color='blue')

fig = plt.figure()
ax = fig.add_axes([0.1, 0.1, 0.8, 0.8])
ax.grid(color='blue')
ax.plot(x, y)
#设置坐标轴 set_xlabel...
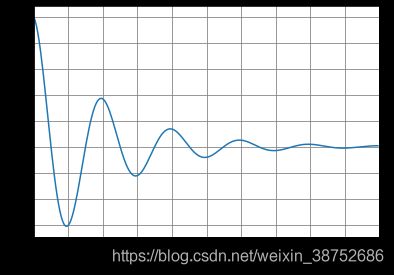
fig = plt.figure()
ax = fig.add_axes([0.1, 0.1, 0.8, 0.8])
ax.grid(color='gray')
ax.plot(x, y)

ax.set_xlabel("x axis")    #设置x轴名称
ax.set_ylabel("y axis")
ax.set_xlim((-2, 10))      #设置x轴的大小
fig = plt.figure()
ax = fig.add_axes([0.1, 0.1, 0.8, 0.8])
ax.grid(color='gray')
ax.plot(x, y)

ax.set_xlabel("x axis")
ax.set_xlim((0, 5))

ax.set_xticks(np.linspace(0, 5, 11))  #设置x轴每格的大小,副坐标

plt.show()
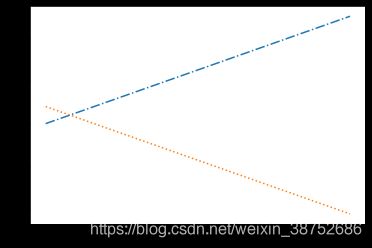
plt.plot(x, 2*x, linestyle="dashdot")
plt.plot(x, -2*x + 2, linestyle=":")
x = np.linspace(-np.pi, np.pi, 9)
plt.plot(x, np.cos(x), linewidth=8)
a = np.arange(0, 3, .02)
b = np.arange(0, 3, .02)
c = np.exp(a)
d = c[: : -1]

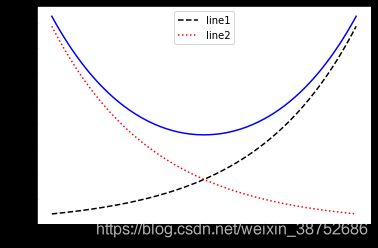
plt.plot(a, c, 'k--', label="Model")
plt.plot(a, d, 'r:', label="Data")
plt.plot(a, c+d, 'b-', label="Total")
plt.legend(loc='upper right')
#label设置曲线名称,plt.legend设置图例位置
line1, = plt.plot(a, c, 'k--', label="Model")    #①
line2 =plt.plot(a, d, 'r:', label="Data")[0]     #②
line3, =plt.plot(a, c+d, 'b-', label="Total")
plt.legend(['line1','line2'],loc=0)    #③
#绘制指定曲线图例,需要使用列表传参,列表内曲线以字符串形式
#将曲线赋值对象,①line, :需要在对象line后加, ;②line=...[0],取第一个返回值
plt.legend(loc='best',frameon=False) #去掉图例边框
plt.legend(loc='best',edgecolor='blue') #设置图例边框颜色
plt.legend(loc='best',facecolor='blue') #设置图例背景颜色,若无边框,参数无效
或者
legend = plt.legend(["First", "Second"])
frame = legend.get_frame()
frame.set_facecolor('blue')

plt.legend(["BJ", "SH"],loc='upper left',title='Beijing VS Shanghai')  #参数分别为:图例标签名,图例位置,图例名
绘制各类图基础使用
#绘制曲线图
%matplotlib inline
import numpy as np
import pandas as pd
import matplotlib.pyplot as plt

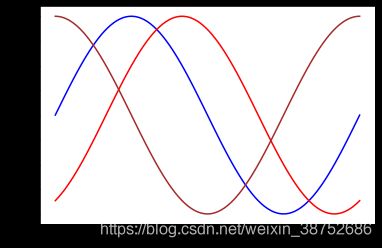
x = np.linspace(0, 2*np.pi, 100)
plt.plot(x, np.sin(x), color='blue')
plt.plot(x, np.sin(x-np.pi/3), color='r')
plt.plot(x, np.cos(x), color='#A52A2A')
#color有以上几种写法
plt.plot(range(10), linestyle='--', marker='o',
         markersize=16, markerfacecolor='b', color='r')
#plt.plot(range(10), '--or', markersize=16, markerfacecolor='b')
plt.grid(True)
#h:正六边形;o:圆形;D:菱形
#maker:数据点;makersize:数据点大小;makerfacecolor:数据点颜色
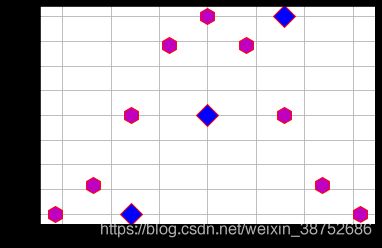
x = np.linspace(-np.pi, np.pi, 9)
plt.plot(x, np.sin(x), 'Dr',
         markersize=16, markerfacecolor='b', markevery=[2,4,6])
plt.plot(x, np.cos(x), 'hr',
         markersize=16, markerfacecolor='m')
plt.grid(True)
#markevery参数使用列表,规定数据点显示的位置,第几个数据点显示出来
#绘制散点图 plt.scatter
rng = np.random.RandomState(0)    #①
x = rng.randn(100)    #②
y = rng.randn(100)
colors = rng.rand(100)    #③
sizes = 1000 * rng.rand(100)

plt.scatter(x, y, c=colors, s=sizes, alpha=0.3)    #④ 参数alpha:透明度
plt.colorbar()
#柱形图 plt.bar
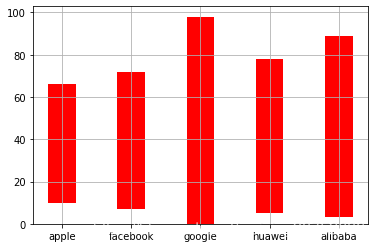
position = ['apple', 'facebook', 'google', 'huawei', 'alibaba']
data = [56, 65, 98, 73, 86]
plt.bar(x=position, height=data, width=0.4, bottom=[10,7,0,5,3], color='red', linewidth=5)
plt.grid(True)
#参数x:表示x轴;参数height:表示y轴;参数width:表示柱宽;参数bottom:表示柱离x轴距离;
#参数align:表示x轴主刻度对应柱子的位置;
#簇状柱形图
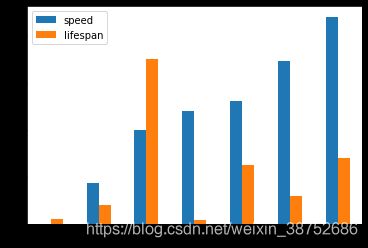
speed = [0.1, 17.5, 40, 48, 52, 69, 88]
lifespan = [2, 8, 70, 1.5, 25, 12, 28]
index = ['snail', 'pig', 'elephant', 'rabbit', 'giraffe', 'coyote', 'horse']
df = pd.DataFrame({'speed': speed,'lifespan': lifespan}, index=index)
df.plot.bar(rot= 0)
#dataframe对象使用plot.bar函数
#将簇状柱形图分离
axes = df.plot.bar(rot=0, subplots=True)
#正负柱形图
n = 12
X = np.arange(n)
Y1 = (1 - X / float(n)) * np.random.uniform(0.5, 1.0, n)

plt.bar(X, +Y1, facecolor='#9999ff', edgecolor='white')
plt.bar(X, -Y1, facecolor='#ff9999', edgecolor='white')

for x, y in zip(X, Y1):
    plt.text(x + 0.4, y + 0.05, '%.2f' % y, ha='center', va='bottom')

plt.ylim(-1.25, +1.25)
#np.random.uniform(0.5, 1.0, n)返回0.5-1之间的n个数
#plt.bar(X, -Y1, facecolor='#ff9999', edgecolor='white')表示负柱形图
#plt.text(x + 0.4, y + 0.05, '%.2f' % y, ha='center', va='bottom'):设置数据标签
#x+0.4,y+0.05是柱形图数据标签的位置,'%.2f' % y:柱形的数据显示y的值,保留2位小数
#条形图 plt.barh
position = np.arange(1, 6)
a = np.random.random(5)
plt.barh(position, a)
#正负条形图
position = np.arange(1, 6)
a = np.random.random(5)
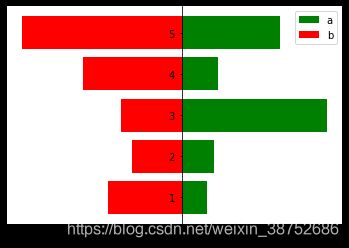
b = np.random.random(5)

plt.barh(position, a, color='g', label='a')
plt.barh(position, -b, color='r', label='b')

plt.legend(loc=0)

ax = plt.gca()
ax.spines['right'].set_color('none')
ax.spines['top'].set_color('none')
ax.yaxis.set_ticks_position('left')
ax.spines['left'].set_position(('data',0))
#正负条形图:plt.barh(position, a, color='g', label='a')
#           plt.barh(position, -b, color='r', label='b')
#ax = plt.gca()  挪动支柱,即画纸边框
#ax.spines['right'].set_color('none'):画纸右边框隐形
#ax.yaxis.set_ticks_position('left')   获取你想要挪动的坐标轴y轴
#ax.spines['left'].set_position(('data',0)) :'data'表示按数值挪动,其后数字代表挪动到Y轴的刻度值
#箱线图 boxplot
fig,ax = plt.subplots(1, 2)
data = [1, 5, 9, 2]
ax[0].boxplot([data])
ax[0].grid(True)
ax[1].boxplot([data], showmeans=True)    # 显示平均值
ax[1].grid(True)
#fig,ax = plt.subplots(m,n,figsize=(a,b)) 画出m*n个子图,子图size为a*b,fig为图片变量,ax为m*n的坐标变量(数组),分别指向相应生成子图图的坐标
plt.boxplot([2,4,6,8,10], notch=True)
plt.grid(1)
# notch:默认为None,如果为True,则意味着绘制有凹槽的箱线图。
np.random.seed(10)
collectn_1 = np.random.normal(100, 10, 200)
collectn_2 = np.random.normal(80, 30, 200)
collectn_3 = np.random.normal(90, 20, 200)
collectn_4 = np.random.normal(70, 25, 200)
data = [collectn_1, collectn_2, collectn_3, collectn_4]

fig = plt.figure(1, figsize=(9, 6))
ax = fig.add_subplot(111)    #将画布分为1行1列第一个子图
bp = ax.boxplot(data, patch_artist=True) #patch_artist,四分位间距框填充颜色
#dataframe画箱线图
import pandas as pd
import numpy as np
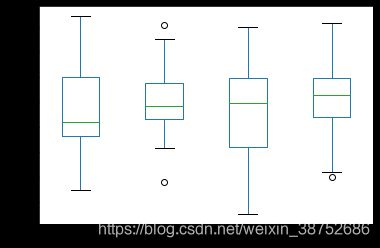
data = np.random.randn(25, 4)
df = pd.DataFrame(data, columns=list('ABCD'))
ax = df.plot.box()
#箱线图设置样式等等
fig = plt.figure(1, figsize=(9, 6))
ax = fig.add_subplot(111)
bp = ax.boxplot(data, patch_artist=True)

# 修改矩形框内的填充色和矩形框的边线
for box in bp['boxes']:
    box.set( color='#7570b3', linewidth=2)    # 矩形框边线颜色和粗细
    box.set( facecolor = '#1b9e77' )    # 填充色

# 须线的粗细和颜色
for whisker in bp['whiskers']:
    whisker.set(color='red', linewidth=2)

# 表示上下限的线的颜色和粗细
for cap in bp['caps']:
    cap.set(color='black', linewidth=2)

# 表示中位数的的线的颜色和粗细
for median in bp['medians']:
    median.set(color='#b2df8a', linewidth=4)

# 表示离群值的符号设置
for flier in bp['fliers']:
    flier.set(marker='*', color='#e7298a', alpha=0.5)

# 设置坐标轴
ax.set_xticklabels(['Sample1', 'Sample2', 'Sample3', 'Sample4'])
ax.get_xaxis().tick_bottom()
ax.get_yaxis().tick_left()
#饼图 pie
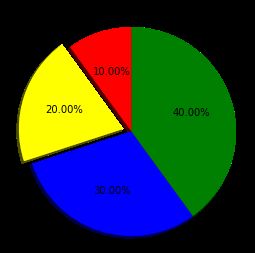
x = [2, 4, 6 ,8]
fig, ax = plt.subplots()
labels = ['A', 'B', 'C', 'D']
colors = ['red', 'yellow', 'blue', 'green']
explode = (0, 0.1, 0, 0)
ax.pie(x, explode=explode, labels=labels,
       colors=colors, autopct='%1.2f%%', shadow=True, startangle=90, radius=1.2)
ax.set(aspect="equal", title='Pie')
#explode:偏离度;autopct:保留几位小数,且是百分数;shadow:阴影;startangle=90:逆时针绘制;radius:半径。
#直方图 hist
import matplotlib
matplotlib.rcParams['font.sans-serif']=['SimHei']    #显示中文
matplotlib.rcParams['axes.unicode_minus'] =False    #显示负号
data = np.random.randn(10000)    # ④
plt.hist(data, bins=40, density=True, facecolor="blue", edgecolor="black", alpha=0.7)
plt.xlabel("区间")
plt.ylabel("频率")
plt.title("频数/频率分布直方图")
#bins:分组的数量;density=True:表示是频率直方图;
x = np.random.normal(size=100)
n, bins, patches = plt.hist(x)
plt.setp(patches[0], 'facecolor', 'g')    # ①
max_index = np.where(n==np.max(n))[0][0]    # ②
plt.setp(patches[max_index], facecolor='red')    # ③
#n:表示每一组的频数;bins:表示每一分组的左右边界;patches:表示直方图中的每一个方块对象的集合
#注释①:获取第一个方块,颜色设置为绿
#注释②:获取最大频数方块的索引值
#注释③:将频数最大的方块设置颜色为红


