GEDI介绍及02B数据预处理**
**
GEDI介绍及02B数据预处理
**
前言
-
前言
随着激光雷达技术的不断发展,星载激光雷达在林分中也扮演着越来越重要的角色,尤其是GEDI数据对于林分的反演国内研究较少,本文就全球生态系统动力学调查(GEDI)的设计目的以及预处理02_B的数据做相关记录。
一、GEDI是什么?
- 什么是GEDI
全球生态系统动力学调查(GEDI)仪器旨在表征生态系统结构和动态,从而从根本上改善对地球碳循环和生物多样性的量化和理解。GEDI仪器可对地球的三维结构进行高分辨率激光测距观测。GEDI于2018年12月5日发射升空,隶属于国际空间站(ISS)。GEDI以迄今为止在轨任何光探测和测距(激光雷达)仪器的最高分辨率和最密集的采样收集全球北纬51.6°至51.6°之间的数据。GEDI仪器由3个激光器组成,共产生8个光束地面横断面,其中包括约30米(m)的足迹样本,沿轨道间隔约60米。GEDI光束横断面在地球表面的交叉轨道方向上相距约600米,横道宽度约为4.2公里(km)。GEDI对森林冠层高度、冠层垂直结构和地表高程的测量可以大大提高我们表征碳和水循环过程、生物多样性和栖息地的能力。GEDI数据对于天气预报、森林管理、雪和冰川监测以及数字高程模型的生成也具有巨大的价值。
值得注意的是根据NASA发布的数据显示,Version1的数据产品已与2022年2月15退役,官方推荐使用版本2的数据,本博客的研究和介绍主要基于02_B的数据,GEDI设计的数据产品处理级别如下,在NASA数据池中均可下载(除1A级产品不公开)

二、GEDI波段及产品命名规则介绍
- GEDI波段及产品介绍
GEDI包含三个ND:YAG激光器,发射1064nm。这些脉冲每秒发射242次,功率10MJ,以56mard的光束向地球表面发射段脉冲(长14ns),足迹平均直径为25m。
其中两个激光器是全功率的,一个被分成两束,总共四束。BDU可快速将传出的激光束的偏移600米。这产生了八条地面轨道;四个全功率和四个半功率。足迹沿轨相隔60米,轨道相距600米。
- 命名规则
在版本2级别02B产品示例中,以文件名GEDI02_B2019110045136_O01993_01_T02061_02_003_01_V002.h5为例
三、GEDI02_B预处理(基于python)
- 预处理部分
根据NASA发布的GEDI一般性处理过程,GEDI的处理语言主要基于R与python,笔者更加倾向于用python作为数据的处理语言,主要是python语言的简明性与GEDI的相关库的适配性上。
1.引入库
代码如下(示例):
import os
import h5py
import numpy as np
import pandas as pd
import geopandas as gp
from shapely.geometry import Point
import geoviews as gv
from geoviews import opts, tile_sources as gvts
import holoviews as hv
gv.extension('bokeh', 'matplotlib')
2.设置工作环境和检索文件
输入目录定义为当前工作目录。代码如下(示例):
inDir = os.getcwd() + os.sep
注意:如果您已将h5文件放在不同的根目录,则需要更改上面的“inDir”。还需要添加一行:“os.chdir(inDir)”并在下面执行。
3.导入和解释数据
3.1打开GEDI HDF5 文件并读取文件元数据
使用h5py库读取文件
gediL2B = h5py.File(L2B, 'r') # 利用h5py读取文件
导航到hdf5文件
list(gediL2B.keys())
GEDI HDF5 文件包含存储数据和元数据的组。
首先,该组包含文件级元数据。通过读取元数据可以可以得到数据的创建日期,版本ID等。
list(gediL2B['METADATA'])
for g in gediL2B['METADATA']['DatasetIdentification'].attrs: print(g)
print(gediL2B['METADATA']['DatasetIdentification'].attrs['purpose'])
3.2按波束读取 SDS 元数据和子集
上文解释了,GEDI由3个激光器组成,共产生8个光束横断面。读取各个波段的光束信息,代码如下:
beamNames = [g for g in gediL2B.keys() if g.startswith('BEAM')]
beamNames
从每个波束横断面中检索一个有用的元数据判断它是全功率波束还是覆盖波束
for g in gediL2B['BEAM0000'].attrs: print(g)
for b in beamNames:
    print(f"{b} is a {gediL2B[b].attrs['description']}")
3.3可视化 GEDI 轨道
按图层划分的子集并创建地理数据帧,读取 SDS 并获取具有代表性的样本(每 100 次拍摄)并附加到列表中,然后使用这些列表生成数据帧。
lonSample, latSample, shotSample, qualitySample, beamSample = [], [], [], [], []

# 打开SDS
lats = gediL2B[f'{beamNames[0]}/geolocation/lat_lowestmode'][()]
lons = gediL2B[f'{beamNames[0]}/geolocation/lon_lowestmode'][()]
shots = gediL2B[f'{beamNames[0]}/geolocation/shot_number'][()]
quality = gediL2B[f'{beamNames[0]}/l2b_quality_flag'][()]

# 将步长设置100并且遍历列表
for i in range(len(shots)):
    if i % 100 == 0:
        shotSample.append(str(shots[i]))
        lonSample.append(lons[i])
        latSample.append(lats[i])
        qualitySample.append(quality[i])
        beamSample.append(beamNames[0])

# 写入波段
latslons = pd.DataFrame({'Beam': beamSample, 'Shot Number': shotSample, 'Longitude': lonSample, 'Latitude': latSample,
                         'Quality Flag': qualitySample})
latslons
下面,创建一个名为“几何图形”的附加列,其中包含从镜头的每个纬度/经度位置生成的点。并转换为地理数据帧。
latslons['geometry'] = latslons.apply(lambda row: Point(row.Longitude, row.Latitude), axis=1)
latslons = gp.GeoDataFrame(latslons)
latslons = latslons.drop(columns=['Latitude','Longitude'])
latslons['geometry']
3.4可视化地理数据帧
-在本节中,使用 GeoDataFrame 和 python 包在底图上对 GEDI 镜头的位置进行空间可视化,示例:根河导入感兴趣空间区域的 GeoJSON 文件。
def pointVisual(features, vdims):
    return (gvts.EsriImagery * gv.Points(features, vdims=vdims).options(tools=['hover'], height=500, width=900, size=5,
                                                                        color='yellow', fontsize={'xticks': 10, 'yticks': 10,
                                                                                                  'xlabel':16, 'ylabel': 16}))
将根河的GeoJSON 作为附加地理数据帧导入。
redwoodNP = gp.GeoDataFrame.from_file('genhe.geojson') # 导入json文件作为地理数据帧
在下面定义 vdims 将允许您将鼠标悬停在特定镜头上并查看有关它们的信息。
vdims = []
for f in latslons:
    if f not in ['geometry']:
        vdims.append(f)
vdims
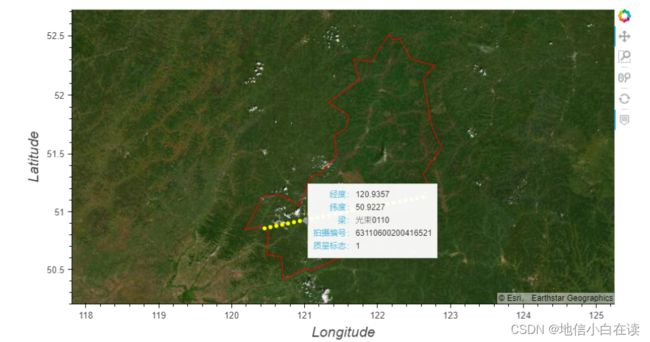
gv.Polygons(redwoodNP['geometry']).opts(line_color='red', color=None) * pointVisual(latslons, vdims = vdims)
输出可以看到落在根河区域的GEDI镜头

在图中的1代表激光射击符合基于能量、灵敏度、振幅和实时表面跟踪质量的标准。0则表示质量较差。
3.5可视化PAVD
- L2B产品包含来自地理定位(1A)的GEDI返回波形的生物物理信息,包括冠层覆盖和植物面积指数(PAI)的总和垂直剖面,垂直植物面积体积密度(PAVD)剖面图和叶面高度多样性(FHD)。
导入PAVD指标,并输出PAVD数据集,为了更好的说明PAVD指标,需要打开图层并且定义正确的垂直步长(这里为5米)。
pavd = gediL2B[[g for g in beamSDS if g.endswith('/pavd_z')][0]]```
# Grab vertical step size
dz = gediL2B[f'{beamNames[0]}/ancillary/dz'][0]
PAVD在每个镜头中包括了30个step,我们尝试获取定义的镜头位置,高程以及PAVD指标:
elev = gediL2B[f'{beamNames[0]}/geolocation/elev_lowestmode'][()]  # Latitude
lats = gediL2B[f'{beamNames[0]}/geolocation/lat_lowestmode'][()]  # Latitude
lons = gediL2B[f'{beamNames[0]}/geolocation/lon_lowestmode'][()]  # Longitude
shotElev = elev[index]
shotLat = lats[index]
shotLon = lons[index]
shotPAVD = pavd[index]
将PAVD重新格式化为包含每个PAVD值和高度的元组列表。并利用path函数绘制每个镜头。
pavdAll = []
pavdElev = []

for i, e in enumerate(range(len(shotPAVD))):
    if shotPAVD[i] > 0:
        pavdElev.append((shot, shotElev + dz * i, shotPAVD[i]))
 pavdAll.append(pavdElev)
 path1 = hv.Path(pavdAll, vdims='PAVD').options(color='PAVD', clim=(0,0.1), cmap='Greens', line_width=20, colorbar=True,
                                               width=700, height=550, clabel='PAVD', xlabel='Shot Number',
                                               ylabel='Elevation (m)', fontsize={'title':16, 'xlabel':16, 'ylabel': 16,
                                                                                 'xticks':12, 'yticks':12,
                                                                                 'clabel':12, 'cticks':10})
3.6使用GEDI L2B 光束横断面
- 接下来,为 BEAM0110 导入多个所需的 SDS 图层(用于整个轨道),并创建一个数据帧来存储数组。
dem = gediL2B[[g for g in beamSDS if g.endswith('/digital_elevation_model')][0]][()]
zElevation = gediL2B[[g for g in beamSDS if g.endswith('/elev_lowestmode')][0]][()]
zHigh = gediL2B[[g for g in beamSDS if g.endswith('/elev_highestreturn')][0]][()]
zLat = gediL2B[[g for g in beamSDS if g.endswith('/lat_lowestmode')][0]][()]
zLon = gediL2B[[g for g in beamSDS if g.endswith('/lon_lowestmode')][0]][()]
canopyHeight = gediL2B[[g for g in beamSDS if g.endswith('/rh100')][0]][()]
quality = gediL2B[[g for g in beamSDS if g.endswith('/l2b_quality_flag')][0]][()]
degrade = gediL2B[[g for g in beamSDS if g.endswith('/degrade_flag')][0]][()]
sensitivity = gediL2B[[g for g in beamSDS if g.endswith('/sensitivity')][0]][()]
pavd = gediL2B[f'{beamNames[0]}/pavd_z'][()]
shotNums = gediL2B[f'{beamNames[0]}/shot_number'][()]

#创建索引
shotIndex = np.arange(shotNums.size)
- 在GEDI L2B产品中,植被覆盖高度以单位(厘米)存储,因此下面转换为米。
canopyHeight = canopyHeight / 100
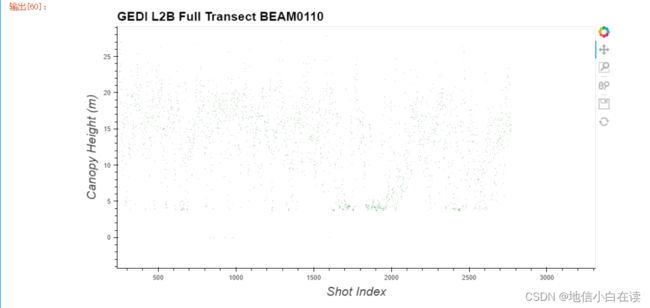
将所需的 SDS 转换为数据帧,开始绘制整个波束横断面图:(将镜头标记为0的删除)
canopyVis = hv.Scatter((transectDF['Shot Index'], transectDF['Canopy Height (rh100)']))
canopyVis.opts(color='darkgreen', height=500, width=900, title=f'GEDI L2B Full Transect {beamNames[0]}',
               fontsize={'title':16, 'xlabel':16, 'ylabel': 16}, size=0.1, xlabel='Shot Index', ylabel='Canopy Height (m)')
3.7绘制光束横断面图
- 接下来,使用 Scatter函数绘制高质量值的完整剩余横断面图。将Tandem-X 的高程、GEDI 的高程和树冠顶部高程组合在一个横断面图中。
demVis = hv.Scatter((transectDF['Shot Index'], transectDF['Tandem-X DEM']), label='Tandem-X DEM')
demVis = demVis.opts(color='black', height=500, width=900, fontsize={'xlabel':16, 'ylabel': 16}, size=1.5)
zVis = hv.Scatter((transectDF['Shot Index'], transectDF['Elevation (m)']), label='GEDI-derived Elevation')
zVis = zVis.opts(color='saddlebrown', height=500, width=900, fontsize={'xlabel':16, 'ylabel': 16}, size=1.5)
rhVis = hv.Scatter((transectDF['Shot Index'], transectDF['Canopy Elevation (m)']), label='Canopy Top Elevation')
rhVis = rhVis.opts(color='darkgreen', height=500, width=900, fontsize={'xlabel':16, 'ylabel': 16}, size=1.5,
                   tools=['hover'], xlabel='Shot Index', ylabel='Elevation (m)')
(demVis * zVis * rhVis).opts(show_legend=True, legend_position='top_left',fontsize={'title':14, 'xlabel':16, 'ylabel': 16},
                             title=f'{beamNames[0]} Full Transect: {L2B.split(".")[0]}')
3.8绘制剖面图
- 将PAVD 重新格式化为包含每个 PAVD 值和高度的元组列表。
pavdAll = []
for j, s in enumerate(transectDF.index):
    pavdShot = transectDF['Plant Area Volume Density'][s]
    elevShot = transectDF['Elevation (m)'][s]
    pavdElev = []

    # Remove fill values
    if np.isnan(pavdShot).all():
        continue
    else:
        del pavdShot[0]
    for i, e in enumerate(range(len(pavdShot))):
        if pavdShot[i] > 0:
        pavdElev.append((distance[j], elevShot + dz * i, pavdShot[i]))
    pavdAll.append(pavdElev)
 canopyElevation = [p[-1][1] for p in pavdAll]
- 下面,使用 Path函数绘制每个镜头,在第三维中以绿色阴影绘制 PAVD。
import warnings
warnings.filterwarnings('ignore')
path1 = hv.Path(pavdAll, vdims='PAVD').options(color='PAVD', clim=(0,0.3), cmap='Greens', line_width=8, colorbar=True,
                                               width=950, height=500, clabel='PAVD', xlabel='Distance Along Transect (m)',
                                               ylabel='Elevation (m)', fontsize={'title':16, 'xlabel':16, 'ylabel': 16,
                                                                                 'xticks':12, 'yticks':12,
                                                                                 'clabel':12, 'cticks':10})
3.8可视化所有BEAM,树冠高度,高程以及植被面积指数
- 使用根河的地理数据帧。
allDF['Shot Number'] = allDF['Shot Number'].astype(str)  # Convert shot number to string

vdims = []
for f in allDF:
    if f not in ['geometry']:
        vdims.append(f)

visual = pointVisual(allDF, vdims = vdims)
visual * gv.Polygons(redwoodNP['geometry']).opts(line_color='red', color=None)
- 为了参数的可视化,我们不仅要绘制地理数据帧中的点,还要为树冠高度 (m)、高程 (m) 和植物面积指数 (PAI) 添加色彩映射表。
allDF['Canopy Height (rh100)'] = allDF['Canopy Height (rh100)'] / 100
(gvts.EsriImagery * gv.Points(allDF, vdims=vdims).options(color='Canopy Height (rh100)',cmap='plasma', size=3, tools=['hover'],
                                                          clim=(0,102), colorbar=True, clabel='Meters',
                                                          title='GEDI Canopy Height over genhe: 4.10, 2022',
                                                          fontsize={'xticks': 10, 'yticks': 10, 'xlabel':16, 'clabel':12,
                                                                    'cticks':10,'title':16,'ylabel':16})).options(height=500,
                                                                                                                  width=900)
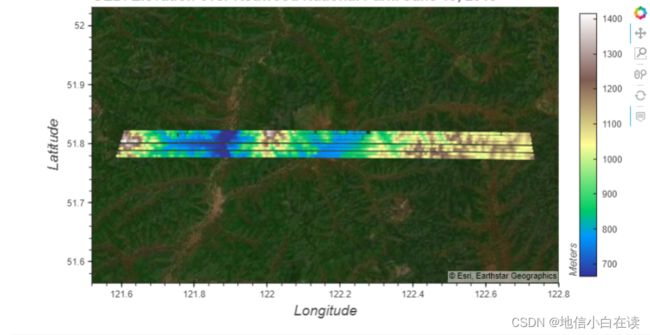
- 接下来,看一下 GEDI 派生的镜头上方的高程。请注意,下面的颜色映射表已更改为“terrain”。
(gvts.EsriImagery * gv.Points(allDF, vdims=vdims).options(color='Elevation (m)',cmap='terrain', size=3, tools=['hover'],
                                                          clim=(min(allDF['Elevation (m)']), max(allDF['Elevation (m)'])),
                                                          colorbar=True, clabel='Meters',
                                                          title='GEDI Elevation over genhe: 4.10, 2022',
                                                          fontsize={'xticks': 10, 'yticks': 10, 'xlabel':16, 'clabel':12,
                                                                    'cticks':10,'title':16,'ylabel':16})).options(height=500,
                                                                                                                  width=900)
- 绘制植物面积指数图(PAI)
(gvts.EsriImagery * gv.Points(allDF, vdims=vdims).options(color='Plant Area Index',cmap='Greens', size=3, tools=['hover'],
                                                          clim=(0,1), colorbar=True, clabel='m2/m2',
                                                          title='GEDI PAI over genhe: 4.10, 2022',
                                                          fontsize={'xticks': 10, 'yticks': 10, 'xlabel':16, 'clabel':12,
                                                                    'cticks':10,'title':16,'ylabel':16})).options(height=500,
                                                                                                                  width=900)
3.9将子集导出为 GeoJSON 文件
- 将所选波段导出为geojson文件以便后续的操作以及相关研究。
outName = gediL2B.filename.replace('.h5', '.json')  # Create an output file name using the input file name
allDF.to_file(outName, driver='GeoJSON')
del allDF
总结
- 关于GEDI参数提取以及镜头可视化的研究,国内现在相关文章较少,本篇博客主要参考了Cole Krehbiel在NASA上公布的相关代码,具体的参数提取,需要针对你所需的研究内容进行调试,上述代码块也是根据笔者所需进行了修改以及参数调试,对于GEDI的研究适用于但不局限于02_B的产品。在林分方面,尤其是反演部分,GEDI国内相关文献较少,相信在不久的将来,类似与icesat系列的林分反演,GEDI也能有相对优秀的结果。同时本篇博客存在的不足也希望各位读者给予意见,关于GEDI的研究也hope各位与我们讨论学习。
微信:18487310237


