数字信号处理_fft做谱分析
文章目录
-
- 实验目的
- 实验步骤
- 要求
- 思考
- 代码实现
-
- 序列的幅频特性
- 小结
实验目的
- 加深DFT算法原理和基本性质的理解(因为FFT只是DFT的一种快速算法,所以FFT的运算结果必然满足DFT的基本性质)
- 熟悉FFT算法原理和FFT子程序的应用
- 学习用FFT对连续信号和时域进行谱分析的方法,了解可能出现的分析误差及其原因,以便在实际中正确应用FFT
实验步骤
例如
x 1 ( n ) = R 4 ( n ) x 2 ( n ) = { n + 1 ( 0 ≤ n ≤ 3 ) 8 − n ( 4 ≤ n ≤ 7 ) 0 其 他 n x 3 ( n ) = { 4 − n ( 0 ≤ n ≤ 3 ) n − 3 ( 4 ≤ n ≤ 7 ) 0 其 他 n x 4 ( n ) = c o s n π 4 x 5 ( n ) = s i n n π 8 x_1(n)=R_4(n)\\ x_2(n)= \begin{cases} n+1&(0\leq n\leq 3)\\ 8-n&(4\leq n\leq 7)\\ 0&其他n \end{cases}\\ x_3(n)= \begin{cases} 4-n&(0\leq n\leq 3)\\ n-3&(4\leq n\leq 7)\\ 0&其他n \end{cases}\\ x_4(n)=cos\frac{n\pi}{4}\\ x_5(n)=sin\frac{n\pi}{8} x1(n)=R4(n)x2(n)=⎩⎪⎨⎪⎧n+18−n0(0≤n≤3)(4≤n≤7)其他nx3(n)=⎩⎪⎨⎪⎧4−nn−30(0≤n≤3)(4≤n≤7)其他nx4(n)=cos4nπx5(n)=sin8nπ
逐个进行谱分析。下面给出针对各信号的FFT变换区间N,以及对连续信号 x 6 ( t ) x_6(t) x6(t)的抽样频率 f s f_s fs;
x i ( n ) ( i = 1 ∼ 5 ) : N = 8 , 16 f s = 64 H z , N = 16 , 32 , 64 x_i(n)~(i=1\sim5):N=8,16\\ f_s=64~Hz,~N=16,32,64 xi(n) (i=1∼5):N=8,16fs=64 Hz, N=16,32,64
要求
结合试验中所给得给定典型序列幅频特性曲线,与理论结果比较,并分析说明误差产生的原因以及用FFT做谱分析有关参数的选择方法
思考
- 在 N = 8 N=8 N=8时, x 2 ( n ) x_2(n) x2(n)和 x 3 ( n ) x_3(n) x3(n)的幅频特性会相同吗?为什么?在 N = 16 N=16 N=16时呢?
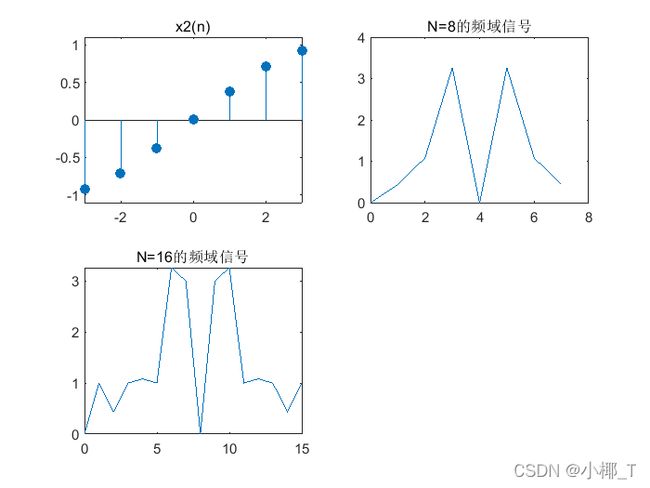
在N=8时,序列 x 2 ( n ) x_2(n) x2(n)与 x 3 ( n ) x_3(n) x3(n)的幅频特性一样,因为fft的取样区间与原序列周期相同,那么那么fft之后结果就是一个为N点的复数,fft变换之后每一个点对应一个频率点,这个点的模值就是该频率下的幅度特性,而在 N = 16 N=16 N=16时,那么fft变换的有些采样点不在原序列频率点上,那些点幅度变大。
下面是 N = 16 N=16 N=16变换后的序列2、3的值
20.0000000000000 + 0.00000000000000i 3.01366974606292 - 15.1507409306070i -5.82842712474619 - 2.41421356237310i -0.248302881332744 + 0.371611523089030i 0.00000000000000 + 0.00000000000000i 0.834089318959649 - 0.557320665045494i -0.171572875253810 - 0.414213562373095i 0.400543816310171 - 0.0796731187415389i 0.00000000000000 + 0.00000000000000i 0.400543816310171 + 0.0796731187415389i -0.171572875253810 + 0.414213562373095i 0.834089318959649 + 0.557320665045494i 0.00000000000000 + 0.00000000000000i -0.248302881332744 - 0.371611523089030i -5.82842712474619 + 2.41421356237310i 3.01366974606292 + 15.1507409306070i
20.0000000000000 + 0.00000000000000i 1.98633025393708 - 9.98595653002223i 5.82842712474619 + 2.41421356237310i 5.24830288133274 - 7.85464033641648i 0.00000000000000 + 0.00000000000000i 4.16591068104035 - 2.78357252455100i 0.171572875253810 + 0.414213562373095i 4.59945618368983 - 0.914888718156751i 0.00000000000000 + 0.00000000000000i 4.59945618368983 + 0.914888718156751i 0.171572875253810 - 0.414213562373095i 4.16591068104035 + 2.78357252455100i 0.00000000000000 + 0.00000000000000i 5.24830288133274 + 7.85464033641648i 5.82842712474619 - 2.41421356237310i 1.98633025393708 + 9.98595653002223i
- 如果周期信号的周期预先不知道,如何用FFT做频谱分析?
可以根据采样定理对它进行2倍于最大频率的抽样,再用fft进行频谱分析
代码实现
序列的幅频特性
在利用FFT对模拟信号进行谱分析时,应将模拟信号离散化以得到离散时间信号。
根据取样定理,为避免混叠失真:(取样频率 f s f_s fs;连续时间信号的最高频率 f 0 f_0 f0)
f s ≥ 2 f 0 或 T ≤ 1 2 f 0 f_s\geq 2f_0 \ 或\ T\leq \frac{1}{2f_0} fs≥2f0 或 T≤2f01
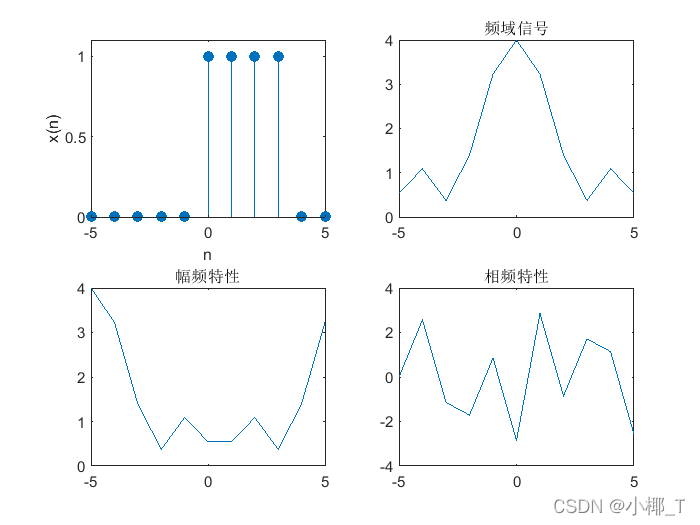
- 序列1
x 1 ( n ) = R 4 ( n ) x_1(n)=R_4(n) x1(n)=R4(n)
n=-5:5;
x=[n>=0&n<=3];%0<=n<=3时x=1
subplot(2,2,1);
stem(n,x,'filled');
axis([-5 5 0 1.1*max(x)]);
xlabel('n');ylabel('x(n)');
xk=fft(x);%快速dft
subplot(2,2,2);
plot(n,fftshift(abs(xk)));%通过将零频分量移动到数组中心,重新排列傅里叶变换X。
axis([-5 5 0 inf]);
title('频域信号');

magx=abs(xk);%幅度
subplot(2,2,3);
plot(n,magx);
title('幅频特性');
subplot(2,2,4);
angx=angle(xk);%相位
plot(n,angx);
title('相频特性');
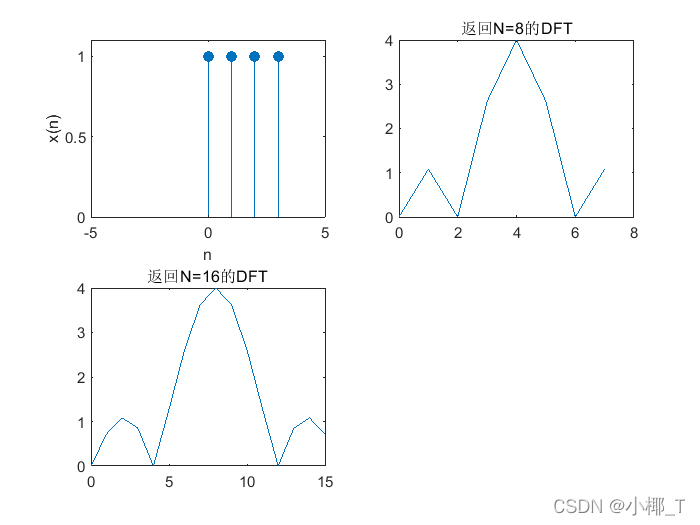
n=-5:5;
x=[n>=0&n<=3];%0<=n<=3时x=1
xn=x(:,6:9);
k1=0:7;
k2=0:15;
subplot(2,2,1);
stem([0:3],xn,'filled');
axis([-5 5 0 1.1*max(x)]);
xlabel('n');ylabel('x(n)');
xk1=fft(xn,8);%返回序列周期N=8
xk2=fft(xn,16);%返回序列周期N=16
subplot(2,2,2);
%通过将零频分量移动到数组中心,重新排列傅里叶变换 X。
plot(k1,fftshift(abs(xk1)));
title('返回N=8的DFT')
subplot(2,2,3);
plot(k2,fftshift(abs(xk2)));
title('返回N=16的DFT')
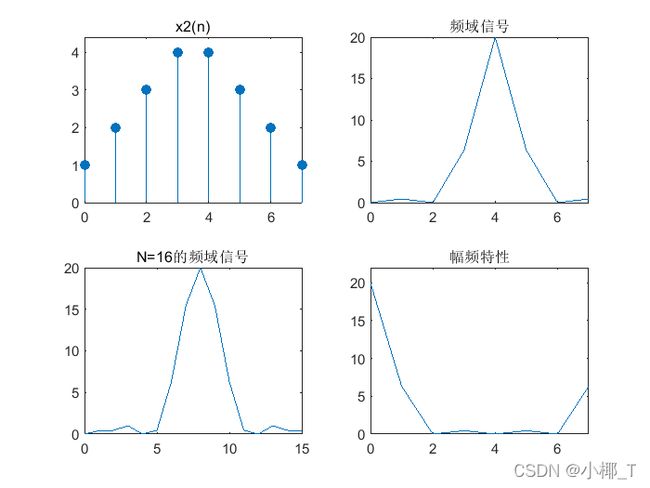
- 序列2
x 2 ( n ) = { n + 1 ( 0 ≤ n ≤ 3 ) 8 − n ( 4 ≤ n ≤ 7 ) 0 其 他 n x_2(n)= \begin{cases} n+1&(0\leq n\leq 3)\\ 8-n&(4\leq n\leq 7)\\ 0&其他n \end{cases} x2(n)=⎩⎪⎨⎪⎧n+18−n0(0≤n≤3)(4≤n≤7)其他n
%序列x2(n)
n1=0:3;
x1=n1+1;
n2=4:7;
x2=8-n2;
x=[x1 x2];
subplot(2,2,1),stem([0:7],x,'filled'),title('x2(n)');
axis([0 7 0 1.1*max(x)]);
%fft
xk=fft(x);
subplot(2,2,2);
plot([n1 n2],fftshift(abs(xk)));
axis([0 7 0 inf]);
title('频域信号');
%N=16的fft
xk16=fft(x,16);
subplot(2,2,3);
plot(0:15,fftshift(abs(xk16)));
axis([0 15 0 inf]);
title('N=16的频域信号');
%幅频特性
magx=abs(xk);%幅度
subplot(2,2,4);
plot([n1 n2],magx);
axis([0 7 0 1.1*max(magx)]);
title('幅频特性');
- 序列3
x 3 ( n ) = { 4 − n ( 0 ≤ n ≤ 3 ) n − 3 ( 4 ≤ n ≤ 7 ) 0 其 他 n x_3(n)= \begin{cases} 4-n&(0\leq n\leq 3)\\ n-3&(4\leq n\leq 7)\\ 0&其他n \end{cases} x3(n)=⎩⎪⎨⎪⎧4−nn−30(0≤n≤3)(4≤n≤7)其他n
从序列结构来看与序列2可以说是一样的,MATLAB代码几乎一样,直接上结果:
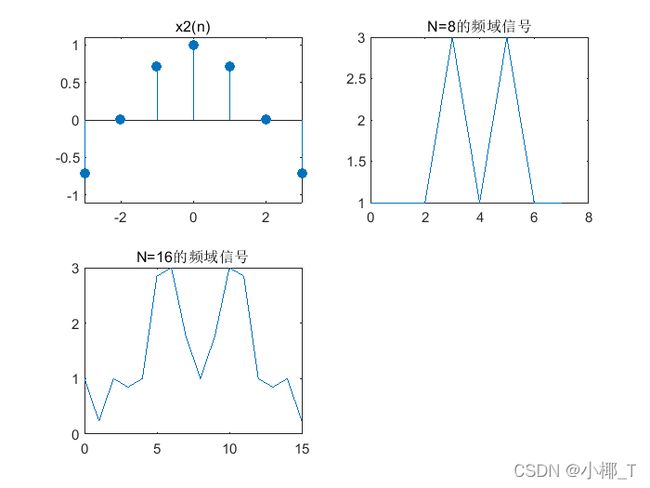
- 序列4
x 4 ( n ) = c o s n π 4 x_4(n)=cos\frac{n\pi}{4} x4(n)=cos4nπ
%序列x4(n)
n=-3:3;
x=cos(n*pi/4);
subplot(2,2,1);
stem([-3:3],x,'filled'),title('x2(n)');
axis([-3 3 -1.1 1.1]);
%N=8的fft
xk=fft(x,8);
subplot(2,2,2);
plot([0:7],fftshift(abs(xk)));
%axis([0 7 0 inf]);
title('N=8的频域信号');
%N=16的fft
xk16=fft(x,16);
subplot(2,2,3);
plot(0:15,fftshift(abs(xk16)));
axis([0 15 0 inf]);
title('N=16的频域信号');
- 序列5
x 5 ( n ) = s i n n π 8 x_5(n)=sin\frac{n\pi}{8} x5(n)=sin8nπ
%把序列4的第三行改成下面
x=sin(n*pi/8);
- 序列6
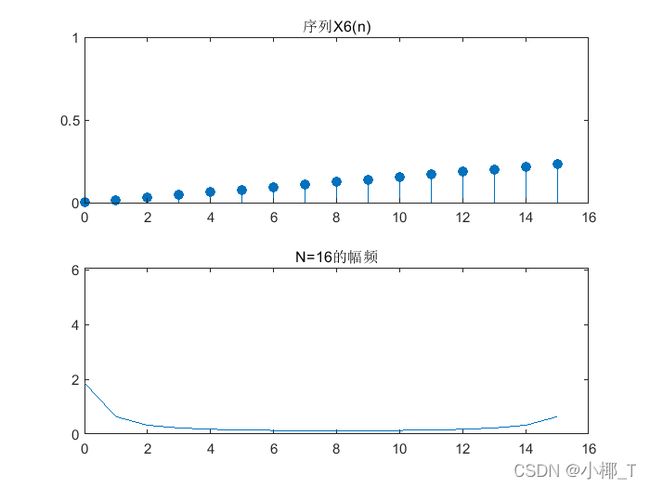
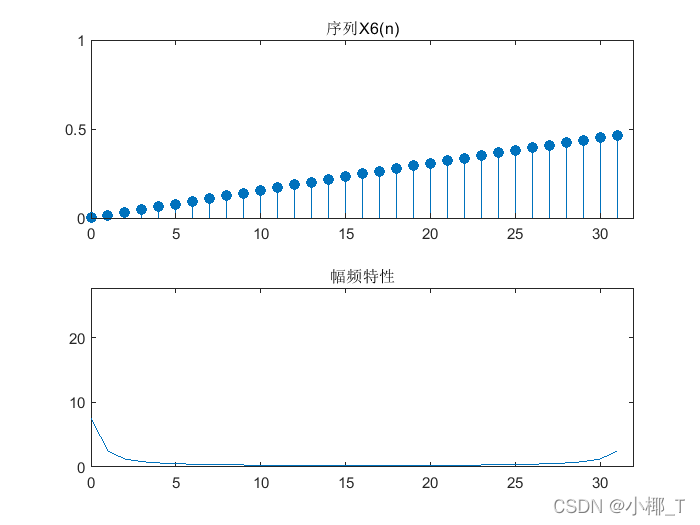
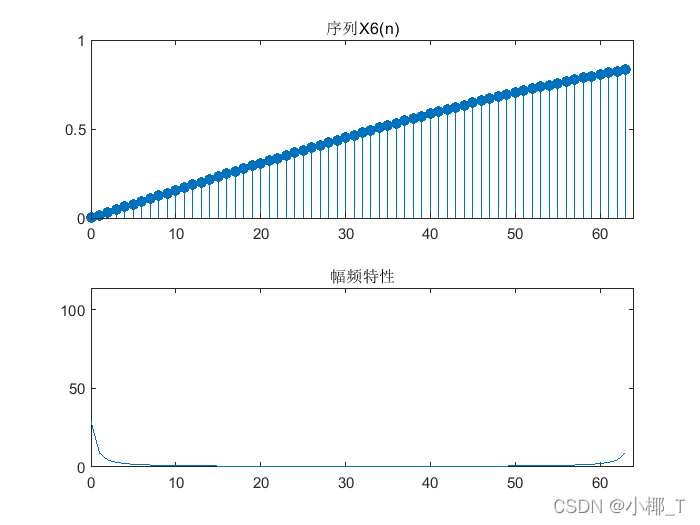
连 续 信 号 x 6 ( n ) f s = 64 H z , N = 16 , 32 , 64 连续信号x_6(n)\\ f_s=64~Hz,~N=16,32,64 连续信号x6(n)fs=64 Hz, N=16,32,64
序列6的取样频率 f s = 64 h z f_s=64hz fs=64hz,那么为了防止出现混叠现象, x 6 ( n ) x_6(n) x6(n)的最高频率最好 f 0 ≤ 32 h z f_0\leq 32hz f0≤32hz
那么取样周期:
T = 1 f s = 1 64 s ≈ 0.02 s T=\frac{1}{f_s}=\frac{1}{64}s\approx0.02s T=fs1=641s≈0.02s
频率分辨率:
F ≥ 2 f 0 N = 4 、 2 、 1 ( N = 16 , 32 , 64 ) F\geq\frac{2f_0}{N}=4、2、1~(N=16,32,64) F≥N2f0=4、2、1 (N=16,32,64)
我们假设模拟信号
x ( t ) = s i n t x(t)=sint x(t)=sint
%序列x6(n)
%需要传入取样点数N
function dsp_demo1(N)
fs=64;T=1/fs;
n=0:N-1;
x=sin(n*T);%模拟信号取样
xn=fft(x,N);
magx=abs(xn);
subplot(2,1,1);
stem(n,x,'filled');title('序列X6(n)');axis([0 N 0 1]);
subplot(2,1,2);
plot(n,magx);title('幅频特性');axis([0 N 0 1.1*sum(magx)]);
end
dsp_demo1(16)
dsp_demo1(32)
dsp_demo1(64)
小结
- 误差分析
周期序列的截断误差与计算机的舍入误差
采样频率不合适时的混叠与泄露
- fft谱分析有关参数的选择方法
对模拟信号谱分析,应该通过采样定理将模拟信号转换成数字信号 x ( n ) x(n) x(n),参数:
f s ≥ 2 f 0 或 T ≤ 1 2 f 0 F = 2 f 0 N f_s\geq 2f_0 \ 或\ T\leq \frac{1}{2f_0}\\ F=\frac{2f_0}{N} fs≥2f0 或 T≤2f01F=N2f0
其中采样频率 f s f_s fs;最大频率 f 0 f_0 f0;采样周期 T T T;采样点数 N N N;频率分辨率 F F F
