Python数据可视化:mplfinance创建蜡烛图(一)
matplotlib的 finance库由mplfinance库替代做为专用于金融数据的可视化分析模块,
是基于matplotlib的实用模块程序。使用前必须确保已经安装了matplotlib和pandas。
1.使用pip安装
pip install mplfinance
2.mpf.plot()函数
2.1 mpf.plot(df)
df必须是包含Open、High、Low和Close数据,带有Pandas DatetimeIndex的Pandas DataFrame对象。
2.1.1 获取股票数据
import pandas as pd
import matplotlib.pyplot as plt
import mplfinance as mpf

plt.rcParams['font.sans-serif'] = ['simHei']  # 以黑体显示中文
plt.rcParams['axes.unicode_minus'] = False  # 解决保存图像符号“-”显示为放块的问题

import tushare as ts  # tushare版本需大于1.2.10

pd.set_option('max_rows', None)
pd.set_option('max_columns', None)
pd.set_option('expand_frame_repr', False)
pd.set_option('display.unicode.ambiguous_as_wide', True)
pd.set_option('display.unicode.east_asian_width', True)

# 输入your token,初始化pro接口
pro = ts.pro_api('你的tushare token')

# 后复权行情
df = ts.pro_bar(ts_code='001227.SZ', adj='hfq', start_date='20000101', end_date='20220426')

df = df.drop(columns=['change', 'pct_chg'])
df['trade_date'] = pd.to_datetime(df['trade_date'], format='%Y-%m-%d')
df.rename(columns={'vol': 'volume'}, inplace=True)
df = df[['trade_date', 'open', 'high', 'low', 'close', 'volume']]
df.set_index('trade_date', drop=True, inplace=True)
df.sort_values(by=['trade_date'], axis=0, ascending=True, inplace=True)
print(df)
2.1.2 股票数据示例
2.1.3 绘图示例
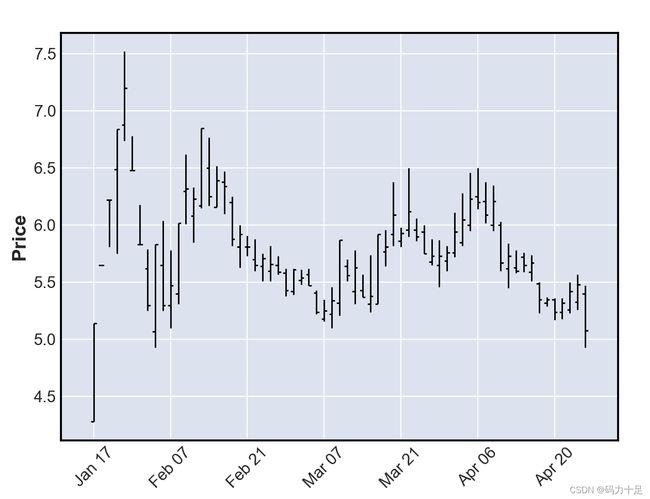
默认绘图类型是“ohlc”。
mpf.plot(df)
2.1.4 更改绘图类型
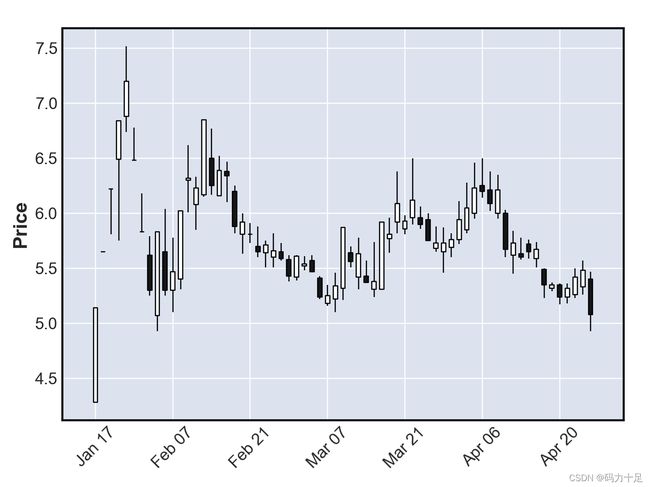
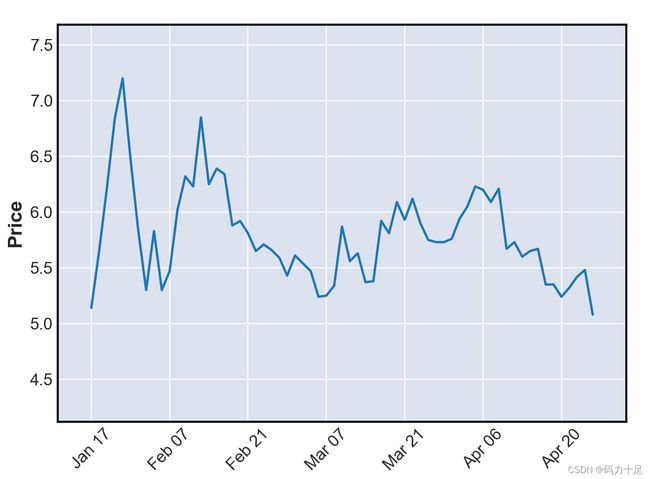
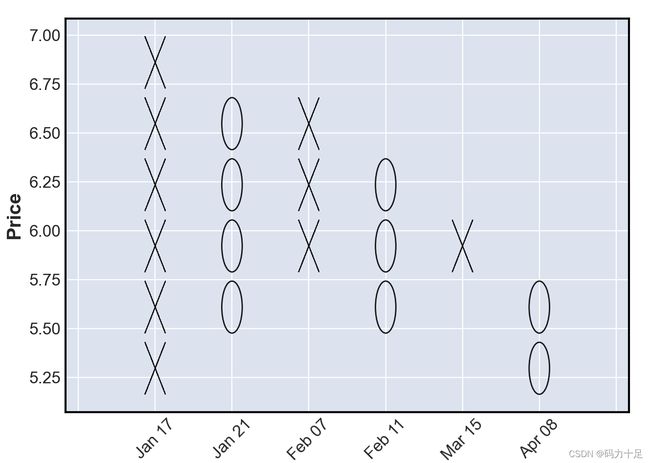
可以使用关键字参数type指定其他绘图类型,
例如type=‘candle’、type=‘line’、type=‘renko’ 或 type=‘pnf’。
mpf.plot(df,type='candle')
mpf.plot(df,type='line')
mpf.plot(df,type='renko')
mpf.plot(df,type='pnf')
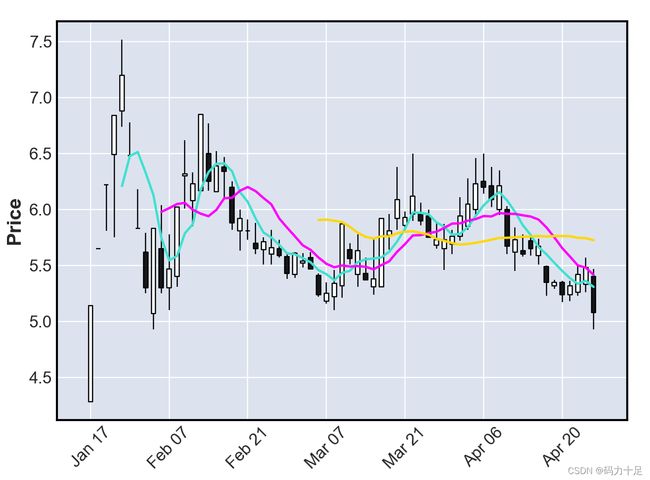
2.1.5 绘制均线
使用mav关键字绘制移动平均线:
①对单个移动平均线使用标量
②对多个移动平均线使用元组或整数列表
mpf.plot(df,type='candle',mav=(5,10,30))
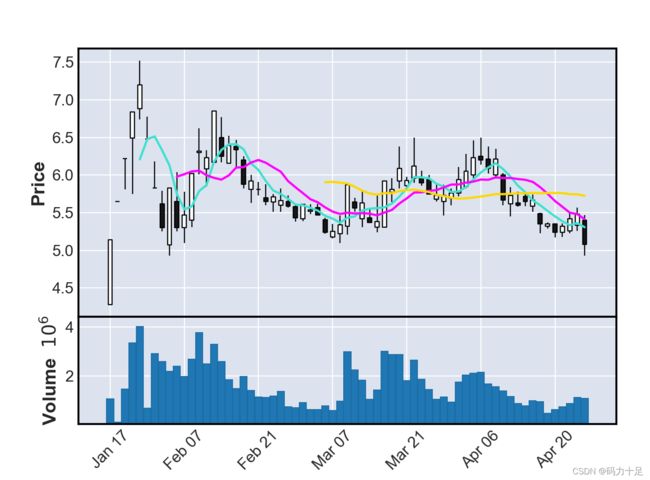
2.1.6 绘制成交量
mpf.plot(df,type='candle',mav=(5,10,30),volume=True)
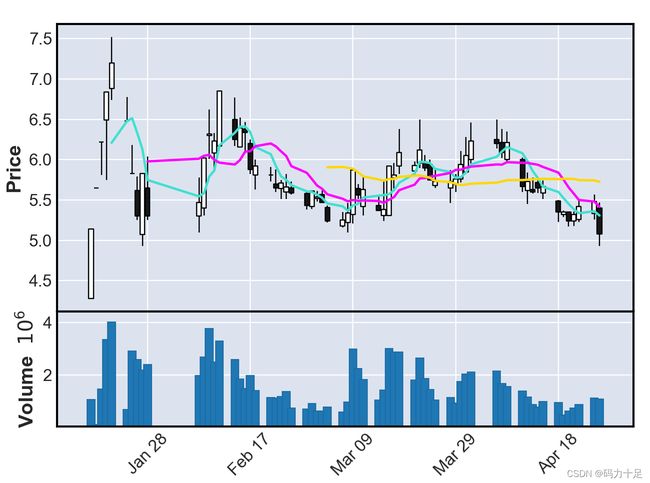
2.1.7 非交易日图形显示
show_nontrading 关键字显示非交易日,show_nontrading=True将显示数据中第一个时间戳和 最后一个时间戳之间的所有日期(所有时间间隔)。
show_nontrading=False(默认值)将仅显示数据中具有实际行的日期时间。
mpf.plot(df,type='candle',mav=(5,10,30),volume=True,show_nontrading=True)
注:文章参考官方文档:https://gitcode.net/mirrors/matplotlib/mplfinance?utm_source=csdn_github_accelerator

