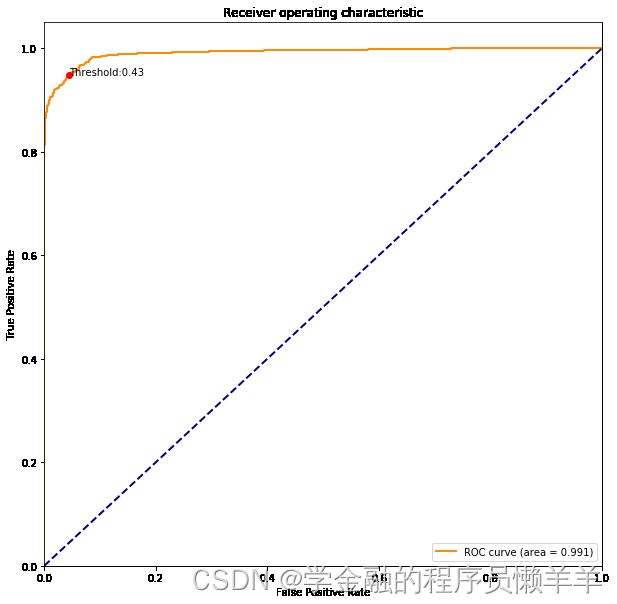
【机器学习系列】【模型评价】【ROC曲线、约登指数最佳阈值】一个函数中实现约登指数计算并集成到ROC图中,给出默认阈值及最佳阈值下的混淆矩阵
输入实际标签、预测的概率值、预测标签,计算最佳阈值,输出ROC曲线,输出默认阈值下的混淆矩阵和最佳阈值下的混淆矩阵
目录
使用约登指数计算最佳阈值
result_evaluation()函数实现约登指数计算并集成到ROC图中,给出默认阈值及最佳阈值下的混淆矩阵
结果展示
使用约登指数计算最佳阈值
#最佳阈值点(使用约登指数)
def Find_Optimal_Cutoff(TPR, FPR, threshold):
    y = TPR - FPR
    Youden_index = np.argmax(y)  # Only the first occurrence is returned.
    optimal_threshold = threshold[Youden_index]
    point = [FPR[Youden_index], TPR[Youden_index]]
    return optimal_threshold, point
result_evaluation()函数实现约登指数计算并集成到ROC图中,给出默认阈值及最佳阈值下的混淆矩阵
#输出混淆矩阵、精确率、召回率、F1、均方误差和确定系数并画roc曲线函数
def result_evaluation(y,prob,pred):
    """
    输入实际标签、预测的概率值、预测标签,计算最佳阈值,输出ROC曲线,输出默认阈值下的混淆矩阵和最佳阈值下的混淆矩阵

    Parameters:
     y - 实际标签(测试集的y)
     prob - 模型预测的概率值(estimtor.predict_proba()的返回值)
     pred - 模型预测值(estimtor.predict()的返回值)
     注:参数数据类型为array

    Returns:
     无

    Raises:
     KeyError - raises an exception
    """
#     if(type(prob)!='array'):
#         prob = np.array(prob)
#     #print(prob)
    fpr,tpr,threshold = roc_curve(y,prob[:,1]) ###计算真正率和假正率
    roc_auc = auc(fpr,tpr) ###计算auc的值
    optimal_th, optimal_point = Find_Optimal_Cutoff(TPR=tpr, FPR=fpr, threshold=threshold)
    plt.figure()
    lw = 2
    plt.figure(figsize=(10,10))
    plt.plot(fpr, tpr, color='darkorange',
             lw=lw, label='ROC curve (area = %0.3f)' % roc_auc) ###假正率为横坐标,真正率为纵坐标做曲线
    plt.plot(optimal_point[0], optimal_point[1], marker='o', color='r')
    plt.text(optimal_point[0], optimal_point[1], f'Threshold:{optimal_th:.2f}')
    plt.plot([0, 1], [0, 1], color='navy', lw=lw, linestyle='--')
    plt.xlim([0.0, 1.0])
    plt.ylim([0.0, 1.05])
    plt.xlabel('False Positive Rate')
    plt.ylabel('True Positive Rate')
    plt.title('Receiver operating characteristic')
    plt.legend(loc="lower right")
    #TN|FP
    #FN|TP
    #混淆矩阵
    pred2 = (prob[:,1] >=optimal_th ).astype(bool)
    print('最佳阈值下混淆矩阵:')
    print(confusion_matrix(y,pred2))
    accuracy = accuracy_score(y, pred2)
    print("准确率:",accuracy)
    pre = metrics.precision_score(y, pred2)
    print("精确率:",pre)
    print("召回率:",metrics.recall_score(y, pred2))
    print("F1",metrics.f1_score(y, pred2))
    print("均方误差",mean_squared_error(y, pred2))
    print("确定系数",r2_score(y, pred2))
    print("*****************************************")
    print("*****************************************")
    print('非最佳阈值下混淆矩阵:')
    print(confusion_matrix(y,pred))
    accuracy = accuracy_score(y, pred)
    print("准确率:",accuracy)
    pre = metrics.precision_score(y, pred)
    print("精确率:",pre)
    print("召回率:",metrics.recall_score(y, pred))
    print("F1",metrics.f1_score(y, pred))
    print("均方误差",mean_squared_error(y, pred))
    print("确定系数",r2_score(y, pred))

    plt.show()
结果展示
最佳阈值下混淆矩阵:
[[3497  161]
 [ 189 3469]]
准确率: 0.952159650082012
精确率: 0.9556473829201102
召回率: 0.948332422088573
F1 0.9519758507135017
均方误差 0.047840349917987975
确定系数 0.8086386003280481
*****************************************
*****************************************
非最佳阈值下混淆矩阵:
[[3558  100]
 [ 270 3388]]
准确率: 0.9494259158009841
精确率: 0.9713302752293578
召回率: 0.9261891744122471
F1 0.9482227819759306
均方误差 0.05057408419901586
确定系数 0.7977036632039366
