Pandas数据处理
本篇文章为《Python数据科学手册》第三章笔记
导入pandas库
import pandas as pd 目录
-
- Pandas对象介绍
- Series
- DataFrame
- Index对象
- 数据取值和选择
- Series数据选择方法
- DataFrame数据选择
- Pandas数值运算方法
- 处理缺失值
- Pandas中的缺失值
- 处理缺失值
- 层次索引
- 多级索引的创建
- 多级索引的取值与切片
- 多级索引行列转换
- 多级索引的数据累计方法
- 合并数据集
- 累计分组
- GroupBy
- 数据透视表
- 向量化字符串操作
- 处理时间序列
- 高性能pandas
- Pandas对象介绍
Pandas对象介绍
Series
Series对象是一个带索引数据构成的一维数组,可以通过values属性和index属性分别获取数据,和索引,values返回的结果与NumPy数组类似,index返回的结果是一个类型为pd.Index的类数组对象
data=pd.Series([0.25,0.5,0.75,1.0])
data
输出:
0    0.25
1    0.50
2    0.75
3    1.00
dtype: float64
Series的索引可以被显示的指定,且索引不一定要连续和按照顺序排列,在numpy中数组的索引是被隐式定义的连续的顺序整数
data=pd.Series([0.25,0.5,0.75,1],index=['a','b','c','d'])
data
输出:
a    0.25
b    0.50
c    0.75
d    1.00
dtype: float64
Series可以看做是一种特殊的Python字典,字典可以将任意键映射到一组任意的数据结构,而Series对象其实是一种将类型键映射到一组类型值得数据结构,可以直接使用字典创建Series对象。当使用字典创建Series时,可以指定index参数,这时会根据index筛选出需要的结果,Series对象也只会保留显示定义的键值对。
population_dict = {'California': 38332521,
                   'Texas': 26448193,
                   'New York': 19651127,
                   'Florida': 19552860,
                   'Illinois': 12882135}
population = pd.Series(population_dict)
population
输出:
California    38332521
Texas         26448193
New York      19651127
Florida       19552860
Illinois      12882135
dtype: int64
DataFrame
创建DataFrame的多种方式:
- 通过单个Series对象创建一个单列的DataFrame,columns参数指定的是列的名称
pd.DataFrame(population,columns=['population'])
输出:
    population
California  38332521
Texas   26448193
New York    19651127
Florida     19552860
Illinois 12882135- 通过字典创建,当有些键不存在时,会用缺失值NaN表示
data=[{'a':i,'b':2*1} for i in range(3)]
pd.DataFrame(data)
输出:
    a   b
0   0   2
1   1   2
2 2 2- 通过Series对象字典创建
area_dict = {'California': 423967, 'Texas': 695662, 'New York': 141297,
             'Florida': 170312, 'Illinois': 149995}
area = pd.Series(area_dict)
states = pd.DataFrame({'population': population,
                       'area': area})
states
输出:
        population  area
California  38332521    423967
Texas   26448193    695662
New York    19651127    141297
Florida     19552860    170312
Illinois 12882135 149995- 通过numpy二维数组创建,如果不指定行列索引值,那么行列默认都是整数索引值
pd.DataFrame(np.random.rand(3, 2),
             columns=['foo', 'bar'],
             index=['a', 'b', 'c'])
输出:
    foo     bar
a   0.410249    0.870067
b   0.619584    0.334680
c 0.690344 0.600170- 通过numpy结构化数组创建
A = np.zeros(3, dtype=[('A', 'i8'), ('B', 'f8')])
pd.DataFrame(A)
输出:
    A   B
0   0   0.0
1   0   0.0
2   0   0.0
Index对象
在前面的Series和DataFrame中都使用了,使得他们更加便于引用和调整,下面主要介绍它的主要特性
将Index看做不可变数组,它有许多和numpy相似的地方,都可以通过切片获取值,不同的在于Inde不可变,当对Index进行改变时会报错,这使得多个DataFrame和数组之间进行索引共享时更加安全
将Index看做有序集合
数据取值和选择
Series数据选择方法
- 将Series看做字典,可以使用Python字典的表达式和方法来检测键、索引和值
data=pd.Series([0.25,0.5,0.75,1],index=['a','b','c','d'])
data['b']
输出
0.5
'a' in data
输出:
True
data['e']=1.25
data
输出:
a    0.25
b    0.50
c    0.75
d    1.00
e    1.25
dtype: float64
将Series看做一维数组
具备和NumPy数组的一样的数组数据选择功能,包括索引、掩码、花哨的索引,需要注意的是当使用显示索引(即data[‘a’:’c’])作为切片时,结果包含最后一个索引,而使用隐式索引(即data[0:2])作为切片时不包括最后一个索引。索引器:loc、iloc和ix
切片和取值的用法可能会造成混乱,如,如果你的Series是显式整数索引,那么data[1]使用的就是显示索引,而data[1:3]使用就是隐式索引,所以Pandas提供了一些索引器:loc,表示取值和切片都是显式的:
print(data)
print(data.loc['a'])
print(data.loc['a':'c'])
输出
a    0.25
b    0.50
c    0.75
d    1.00
e    1.25
dtype: float64
0.25
a    0.25
b    0.50
c    0.75
dtype: float64
iloc,表示取值和切片都是Python形式的隐式索引(从0开始,左闭右开区间):
print(data.iloc[1])
print(data.iloc[1:3])
输出:
0.5
b    0.50
c    0.75
dtype: float64ix,是前两种的混合形式(ix从0.20.0开始被弃用)
DataFrame数据选择
- 将DataFrame看作字典
可以通过列名进行字典形式的取值获取数据
area = pd.Series({'California': 423967, 'Texas': 695662,
                  'New York': 141297, 'Florida': 170312,
                  'Illinois': 149995})
pop = pd.Series({'California': 38332521, 'Texas': 26448193,
                 'New York': 19651127, 'Florida': 19552860,
                 'Illinois': 12882135})
data = pd.DataFrame({'area':area, 'pop':pop})
data['area']
输出:
California    423967
Texas         695662
New York      141297
Florida       170312
Illinois      149995
Name: area, dtype: int64
也可以通过属性的形式选择纯字符串列名,且列名不与DataFrame的方法同名的数据:
data.area- 将DataFrame看作二维数组,可以通过单个行索引获取一行的数据,获取列的方法在前面有所介绍
data.values
输出:
array([[  423967, 38332521],
       [  695662, 26448193],
       [  141297, 19651127],
       [  170312, 19552860],
       [  149995, 12882135]], dtype=int64)

data.values[0]
输出:
array([  423967, 38332521], dtype=int64)
loc,iloc获取数据
data.loc[:'Illinois',:'pop']
输出:
        area    pop
California  423967  38332521
Texas   695662  26448193
New York    141297  19651127
Florida     170312  19552860
Illinois    149995  12882135

data.iloc[:3,:2]
        area    pop
California  423967  38332521
Texas   695662  26448193
New York    141297  19651127
- 其它取值方法
多个标签用切片选取行:
data['Florida':'Illinois']
用行数也可以切片:
data[1:3]
掩码操作:
data[data.area>200000]
Pandas数值运算方法
- 保留索引
对于一元运算(像函数与三角函数),这些通用函数的输出结果将保留索引和列标签
rng = np.random.RandomState(42)
ser = pd.Series(rng.randint(0, 10, 4))
df = pd.DataFrame(rng.randint(0, 10, (3, 4)),
                  columns=['A', 'B', 'C', 'D'])
np.exp(ser)
输出:
0     403.428793
1      20.085537
2    1096.633158
3      54.598150
dtype: float64
--------------------
np.sin(df * np.pi / 4)
输出:
    A   B   C   D
0   -1.000000   7.071068e-01    1.000000    -1.000000e+00
1   -0.707107   1.224647e-16    0.707107    -7.071068e-01
2 -0.707107 1.000000e+00 -0.707107 1.224647e-16- 索引对齐
当对两个Series或DataFrame对象进行二元计算时,Pandas会自动对齐两个个对象的索引,对于缺失位置的数据,Pandas会用NaN填充,表示“此处无数”,从下面的输出结果可以看出行列索引可以是不同顺序的,结果的索引会按自动顺序排列
A = pd.Series([2, 4, 6], index=[0, 1, 2])
B = pd.Series([1, 3, 5], index=[1, 2, 3])
A + B
输出:
0    NaN
1    5.0
2    9.0
3    NaN
dtype: float64
----------
A = pd.DataFrame(rng.randint(0, 20, (2, 2)),
                 columns=list('AB'))
B = pd.DataFrame(rng.randint(0, 10, (3, 3)),
                 columns=list('BAC'))
A+B
输出:
A   B   C
0   1.0     15.0    NaN
1   13.0    6.0     NaN
2 NaN NaN NaN- DataFrame和Series的运算
一个DataFrame和一个Series进行计算,是遵循Numpy的广播规则的
A=rng.randint(10,size=(3,4))
df=pd.DataFrame(A,columns=list('QRST'))
df-df.iloc[0]
输出:
    Q   R   S   T
0   0   0   0   0
1   0   7   -8  1
2   -1  2   -8  1
如果需要列运算,就需要运用运算符方法,通过axis参数设置:
df.subtract(df['R'],axis=0)
输出:
    Q   R   S   T
0   8   0   8   6
1   1   0   -7  0
2   5   0   -2  5
处理缺失值
Pandas中的缺失值
1、None:Python对象类型的缺失值
对一个包含None对象的数组进行累计操作,如min和max时,通常会出现类型错误
2、NaN:数值类型的缺失值
在进行累计操作时是合理的,不会抛出异常,但NaN会将数据同化,使得最终结果都是NaN
注:在Pandas中两种类型是可以等价交换的,Pandas会自动将None转换为NaN
处理缺失值
isnull()创建一个布尔类型的掩码标签缺失值
notnull()与isnull相反
data=pd.Series([1,np.nan,'hello',np.nan])
data.isnull()
输出:
0    False
1     True
2    False
3     True
dtype: bool
dropna()返回一个剔除缺失值的数据
data.dropna()
输出:
0        1
2    hello
dtype: object对于DataFrame有时需要设置一些参数,默认会剔除包含缺失值的整行数据,设置axis=1(或axis=‘columns’)就会剔除任何包含缺失值的整列数据;参数how=‘any’,只要有缺失值就剔除整行或整列,how=‘all’,只会剔除全部是缺失值的行或列;thresh参数设置行或列非缺失值得最小数量
df = pd.DataFrame([[1,      np.nan, 2],
                   [2,      3,      5],
                   [np.nan, 4,      6]])
df.dropna(axis='columns',thresh=3)
输出:
    2
0   2
1   5
2   6
层次索引
多级索引的创建
1、通过一个有不同等级的若干简单数组组成的列表来创建MultiIndex:
pd.MultiIndex.from_arrays([['a','a','b','b'],[1,2,1,2]])2、通过多个索引值得元组创建
pd.MultiIndex.from_tuples([('a', 1), ('a', 2), ('b', 1), ('b', 2)])3、使用两个索引的笛卡尔积创建
pd.MultiIndex.from_product([['a', 'b'], [1, 2]])4、直接提供levels和labels创建
pd.MultiIndex(levels=[['a', 'b'], [1, 2]],
              labels=[[0, 0, 1, 1], [0, 1, 0, 1]])
通过index.names可以设置索引的名称
多级索引的取值与切片
1、Series多级索引
- 可以通过多个级别的索引获取单个元素
- 也可以通过某一层次的索引获取部分数据
- 可以使用布尔掩码获取数据
- 使用花哨的索引选取数据
2、 DataFrame多级索引
与Series多级索引类似
index = pd.MultiIndex.from_product([[2013, 2014], [1, 2]],
                                   names=['year', 'visit'])
columns = pd.MultiIndex.from_product([['Bob', 'Guido', 'Sue'], ['HR', 'Temp']],
                                     names=['subject', 'type'])

data = np.round(np.random.randn(4, 6), 1)
data[:, ::2] *= 10
data += 37
health_data = pd.DataFrame(data, index=index, columns=columns)
health_data
health_data['Guido','HR']
输出:
health_data:
subject     Bob     Guido   Sue
    type    HR  Temp    HR  Temp    HR  Temp
year    visit
2013    1   13.0    36.9    30.0    37.2    45.0    35.2
2   27.0    38.1    27.0    37.5    43.0    36.6
2014    1   34.0    38.2    26.0    36.5    24.0    37.1
2   48.0    37.5    55.0    37.3    44.0    38.3

year  visit
2013  1        30.0
      2        27.0
2014  1        26.0
      2        55.0
Name: (Guido, HR), dtype: float64
使用IndexSlice对象获取数据
idx=pd.IndexSlice
health_data.loc[idx[:,1],idx[:,'HR']]
subject     Bob     Guido   Sue
    type    HR  HR  HR
year    visit
2013    1   13.0    30.0    45.0
2014    1   34.0    26.0    24.0
多级索引行列转换
1、当MutliIndex不是有序的索引,那么大多数切片操作会失败,这时可以使用sort_index()和sortlevel()方法进行排序
index = pd.MultiIndex.from_product([['a', 'c', 'b'], [1, 2]])
data = pd.Series(np.random.rand(6), index=index)
data.index.names = ['char', 'int']
data
输出;
char  int
a     1      0.151556
      2      0.164029
c     1      0.681370
      2      0.811158
b     1      0.118525
      2      0.143446
dtype: float64
---------------------------------
data.sort_index()
输出:
char  int
a     1      0.151556
      2      0.164029
b     1      0.118525
      2      0.143446
c     1      0.681370
      2      0.811158
dtype: float64
2、unstack,可以将一个多级索引数据集转换为简单的而为形式,可以通过level设置转换的索引层级,stack是unstack的逆操作
data.unstack(level=1)
输出:
int     1   2
char
a   0.151556    0.164029
b   0.118525    0.143446
c   0.681370    0.811158
3、reset_index可以进行行列标签转换,set_index可以重建索引
data_flat=data.reset_index(name='num')
data_flat
输出:
    char    int     num
0   a   1   0.151556
1   a   2   0.164029
2   c   1   0.681370
3   c   2   0.811158
4   b   1   0.118525
5   b   2   0.143446
-------------------------------
data_flat.set_index(['char','int'])
输出:
    num
char    int
a   1   0.151556
    2   0.164029
c   1   0.681370
    2   0.811158
b   1   0.118525
    2   0.143446
多级索引的数据累计方法
health_data.mean(axis=1,level='type')
输出:
    type    HR  Temp
year    visit
2013    1   29.333333   36.433333
2   32.333333   37.400000
2014    1   28.000000   37.266667
2   49.000000   37.700000
axis:指定沿哪个轴计算,默认为0
level:设置累计的层级
合并数据集
pd.concat
pd.concat(objs, axis=0, join=’outer’, join_axes=None, ignore_index=False, keys=None, levels=None, names=None, verify_integrity=False, sort=None, copy=True)
参数说明
objs : 需要合并的数据
axis : {0/’index’, 1/’columns’}, default 0 沿着合并的轴
join : {‘inner’, ‘outer’}, default ‘outer’ 设置参数的合并方式
join_axes : 指定根据那个轴来对齐数据
ignore_index : boolean, default False,忽略索引
keys : 为数据源设置多级索引
verify_integrity : boolean, default False 检测合并的结果中是否出现重复的索引,将参数设置为True,合并若有重复索引会触发异常
#创建示例数据集
def make_df(cols, ind):
    """Quickly make a DataFrame"""
    data = {c: [str(c) + str(i) for i in ind]
            for c in cols}
    return pd.DataFrame(data, ind)

A=make_df('ABC', range(3))
A
输出:
    A   B   C
0   A0  B0  C0
1   A1  B1  C1
2   A2  B2  C2
--------------------------------
pd.concat([A,A],axis=1)
输出:
    A   B   C   A   B   C
0   A0  B0  C0  A0  B0  C0
1   A1  B1  C1  A1  B1  C1
2   A2  B2  C2  A2  B2  C2
--------------------------------------------------
pd.concat([A,A])
输出:
    A   B   C
0   A0  B0  C0
1   A1  B1  C1
2   A2  B2  C2
0   A0  B0  C0
1   A1  B1  C1
2   A2  B2  C2
--------------------------------------------------
pd.concat([A,A],verify_integrity=True)
输出:
ValueError: Indexes have overlapping values: Int64Index([0, 1, 2], dtype='int64')A.append(other, ignore_index=False, verify_integrity=False, sort=None)相当于concat的简单方法,便于使用
注:Pandas在合并时会保留索引
pd.merge()
pd.merge实现了三种连接的类型:一对一,多对一,多对多,merge会默认丢弃行索引
参数
on:为一个列名字符串或者一个包含多列名称的列表,这个参数只有在DataFrame有共同列名的时候才可以使用
left_on和right_on:合并两个列名不同的数据集
left_index和right_index 将索引设置为键来实现合并
how:设置合并规则inner、outer、left、right
suffixes:当两个DataFrame有重复列名时,可以通过改参数自定义后缀名,默认为_x或_y
累计分组
GroupBy
1、goupy对象
(1)按列取值
按列获取不同方法(method )下所有行星公转周期(orbital_period )的中位数
#导入行星数据
import seaborn as sns
planets=sns.load_dataset('planets')
planets.head()
输出:
    method  number  orbital_period  mass    distance    year
0   Radial Velocity     1   269.300     7.10    77.40   2006
1   Radial Velocity     1   874.774     2.21    56.95   2008
2   Radial Velocity     1   763.000     2.60    19.84   2011
3   Radial Velocity     1   326.030     19.40   110.62  2007
4   Radial Velocity     1   516.220     10.50   119.47  2009
-----------------------------------------------------------------------------
planets.groupby('method')['orbital_period'].median()
输出:
method
Astrometry                         631.180000
Eclipse Timing Variations         4343.500000
Imaging                          27500.000000
Microlensing                      3300.000000
Orbital Brightness Modulation        0.342887
Pulsar Timing                       66.541900
Pulsation Timing Variations       1170.000000
Radial Velocity                    360.200000
Transit                              5.714932
Transit Timing Variations           57.011000
Name: orbital_period, dtype: float64
(2)按组迭代
for (method,group) in planets.groupby('method'):
    print("{0:30s} shape={1}".format(method,group.shape))
输出:
Astrometry                     shape=(2, 6)
Eclipse Timing Variations      shape=(9, 6)
Imaging                        shape=(38, 6)
Microlensing                   shape=(23, 6)
Orbital Brightness Modulation  shape=(3, 6)
Pulsar Timing                  shape=(5, 6)
Pulsation Timing Variations    shape=(1, 6)
Radial Velocity                shape=(553, 6)
Transit                        shape=(397, 6)
Transit Timing Variations      shape=(4, 6)
(3)调用方法
可以让任何不有GoupBy对象直接实现的方法直接饮用到每一组
planets.groupby('method')['year'].describe()
输出:
    count   mean    std     min     25%     50%     75%     max
method
Astrometry  2.0     2011.500000     2.121320    2010.0  2010.75     2011.5  2012.25     2013.0
Eclipse Timing Variations   9.0     2010.000000     1.414214    2008.0  2009.00     2010.0  2011.00     2012.0
Imaging     38.0    2009.131579     2.781901    2004.0  2008.00     2009.0  2011.00     2013.0
Microlensing    23.0    2009.782609     2.859697    2004.0  2008.00     2010.0  2012.00     2013.0
Orbital Brightness Modulation   3.0     2011.666667     1.154701    2011.0  2011.00     2011.0  2012.00     2013.0
Pulsar Timing   5.0     1998.400000     8.384510    1992.0  1992.00     1994.0  2003.00     2011.0
Pulsation Timing Variations     1.0     2007.000000     NaN     2007.0  2007.00     2007.0  2007.00     2007.0
Radial Velocity     553.0   2007.518987     4.249052    1989.0  2005.00     2009.0  2011.00     2014.0
Transit     397.0   2011.236776     2.077867    2002.0  2010.00     2012.0  2013.00     2014.0
Transit Timing Variations   4.0     2012.500000     1.290994    2011.0  2011.75     2012.5  2013.25     2014.0
2、累计、过滤、转换和应用
(1)累计
aggregate()支持字符串、函数、函数列表,并且一次性计算所有累计值
rng = np.random.RandomState(0)
df = pd.DataFrame({'key': ['A', 'B', 'C', 'A', 'B', 'C'],
                   'data1': range(6),
                   'data2': rng.randint(0, 10, 6)},
                   columns = ['key', 'data1', 'data2'])
df
输出:
    key     data1   data2
0   A   0   5
1   B   1   0
2   C   2   3
3   A   3   3
4   B   4   7
5   C   5   9
-----------------------------------------------------
df.groupby('key').aggregate(['min',np.median,max])
输出:
data1   data2
    min     median  max     min     median  max
key
A   0   1.5     3   3   4.0     5
B   1   2.5     4   0   3.5     7
C   2   3.5     5   3   6.0     9
(2)过滤
def filter_func(x):
    return x['data2'].std()>4
df.groupby('key').filter(filter_func)
输出:
    key     data1   data2
1   B   1   0
2   C   2   3
4   B   4   7
5   C   5   9
(3)转换
df.groupby('key').transform(lambda x:x-x.mean())
输出:
data1   data2
0   -1.5    1.0
1   -1.5    -3.5
2   -1.5    -3.0
3   1.5     -1.0
4   1.5     3.5
5   1.5     3.0
(4)apply方法
可以在每个组上应用任意方法
def norm_by_data2(x):
    x['data1']/=x['data2'].sum()
    return x
df.groupby('key').apply(norm_by_data2)
输出:
    key     data1   data2
0   A   0.000000    5
1   B   0.142857    0
2   C   0.166667    3
3   A   0.375000    3
4   B   0.571429    7
5   C   0.416667    9
3、设置分割的键
(1)将列表、数组、Series或索引作为分组键
df.groupby([0,1,0,1,2,0]).sum()
输出:
data1   data2
0   7   17
1   4   3
2   4   7
(2)用字典或Series将索引映射到分组
df2 = df.set_index('key')
mapping = {'A': 'vowel', 'B': 'consonant', 'C': 'consonant'}
df2.groupby(mapping).sum()
输出:
        data1   data2
consonant   12  19
vowel   3   8
(3)任意Python函数,如str.lower
(4)多个有效键构成的列表
df2.groupby([str.lower,mapping]).mean()
输出:
        data1   data2
a   vowel   1.5     4.0
b   consonant   2.5     3.5
c   consonant   3.5     6.0
数据透视表
#获取泰坦尼克号的乘客信息数据库
titanic=sns.load_dataset('titanic')
titanic.head()
输出:
    survived    pclass  sex     age     sibsp   parch   fare    embarked    class   who     adult_male  deck    embark_town     alive   alone
0   0   3   male    22.0    1   0   7.2500  S   Third   man     True    NaN     Southampton     no  False
1   1   1   female  38.0    1   0   71.2833     C   First   woman   False   C   Cherbourg   yes     False
2   1   3   female  26.0    0   0   7.9250  S   Third   woman   False   NaN     Southampton     yes     True
3   1   1   female  35.0    1   0   53.1000     S   First   woman   False   C   Southampton     yes     False
4   0   3   male    35.0    0   0   8.0500  S   Third   man     True    NaN     Southampton     no  True
pivot_table实现数据透视
titanic.pivot_table('survived',index='sex',columns='class')
输出:
class   First   Second  Third
sex
female  0.968085    0.921053    0.500000
male    0.368852    0.157407    0.135447
pivot_table(values=None, index=None, columns=None, aggfunc=’mean’, fill_value=None, margins=False, dropna=True, margins_name=’All’)
aggfunc 可以指定不同的累计函数,累计函数可以用常见的字符串,也可以用标准的累计函数
titanic.pivot_table(index='sex',columns='class',aggfunc={'survived':sum,'fare':'mean'})
输出:
    fare    survived
class   First   Second  Third   First   Second  Third
sex
female  106.125798  21.970121   16.118810   91  70  72
male    67.226127   19.741782   12.661633   45  17  47
margin计算每一组的综述,margins_name指定标签的名字
titanic.pivot_table('survived',index='sex',columns='class',margins=True)
输出:
class   First   Second  Third   All
sex
female  0.968085    0.921053    0.500000    0.742038
male    0.368852    0.157407    0.135447    0.188908
All     0.629630    0.472826    0.242363    0.383838
向量化字符串操作
1、几乎所有的Python内置的字符串方法都被复制到Pandas中
2、正则表达式
| 方法 | 描述 |
|---|---|
| match() | Call re.match() on each element, returning a boolean. |
| extract() | Call re.match() on each element, returning matched groups as strings. |
| findall() | Call re.findall() on each element |
| replace() | Replace occurrences of pattern with some other string |
| contains() | Call re.search() on each element, returning a boolean |
| count() | Count occurrences of pattern |
| replit() | Equivalent to str.split(), but accepts regexps |
| rsplit() | Equivalent to str.rsplit(), but accepts regexps |
3、其它字符串方法
| 方法 | 描述 |
|---|---|
| get() | 获取元素索引位置上的值 |
| slice() | 对元素进行切片取值 |
| slice_replace() | 对元素进行切片替换 |
| cat() | 连接字符串 |
| repeat() | 重复元素 |
| normalize() | 将字符串转为Unicode |
| pad() | 在字符串的左边、右边或两边增加空格 |
| wrap() | 将字符串安装指定的宽度换行 |
| join() | 用分隔符连接Series的每个元素 |
| get_dummies() | 按照分隔符提取每个元素的dummy变量,转换为独热编码的DataFrame |
处理时间序列
1、pandas时间序列数据结构
- 针对时间戳数据,Pandas提供了Timestamp类型,对应的索引数据结构是DatetimeIndex
- 针对时间周期数据,Pandas提供了Period类型,对应的索引数据结构是PeriodIndex
- 针对时间增量或持续时间,pandas提供了Timedelta,对应的索引数据结构是TimedeltaIndex
pd.to_datetiem()返回DatetimeIndex
pd.to_period()返回PeriodIndex
当一个日期减去另一个日期返回的就是TimedeltaIndex
pd.date_range、pd.period-range、pd.timedelata_range与range()功能类似,创建有规律的日期序列,其中参数
有起点、终点、周期数(period)、freq(时间间隔,默认为D)
2、时间频率和偏移量
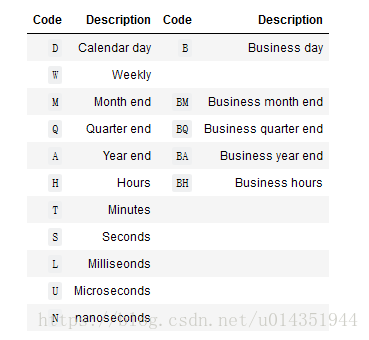
Pandas频率代码

带开始索引的频率代码

频率代码后可以加三位月份缩写改变季、年频率的开始时间
如
Q-JAN, BQ-FEB, QS-MAR, BQS-APR, etc.
A-JAN, BA-FEB, AS-MAR, BAS-APR, etc.
3、重新取样、迁移和窗口
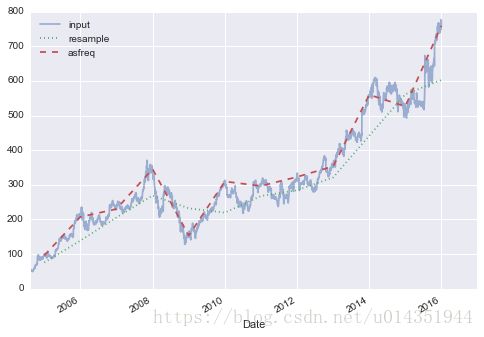
(1)重新取样与频率转换
resample() 以数据累计为基础,进行重新取样
asfreq() 以数据选择为基础 ,进行重新取样
from pandas_datareader import data

goog = data.DataReader('GOOG', start='2004', end='2016',
                       data_source='google')
goog.head()
输出:
    Open    High    Low     Close   Volume
Date
2004-08-19  49.96   51.98   47.93   50.12   NaN
2004-08-20  50.69   54.49   50.20   54.10   NaN
2004-08-23  55.32   56.68   54.47   54.65   NaN
2004-08-24  55.56   55.74   51.73   52.38   NaN
2004-08-25  52.43   53.95   51.89   52.95   NaN
---------------------------------------------------
goog.plot(alpha=0.5, style='-')
goog.resample('BA').mean().plot(style=':')
goog.asfreq('BA').plot(style='--');
plt.legend(['input', 'resample', 'asfreq'],
           loc='upper left');
输出:
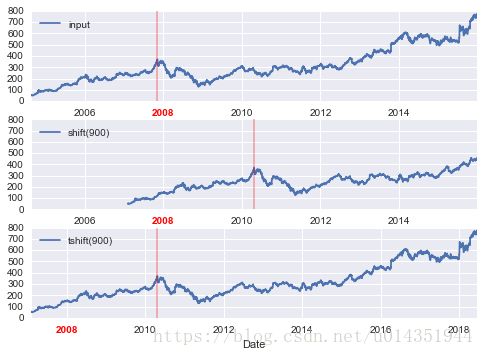
(2)时间迁移
shift():迁移数据
tshift():迁移索引
fig, ax = plt.subplots(3, sharey=True)

# apply a frequency to the data
goog = goog.asfreq('D', method='pad')

goog.plot(ax=ax[0])
goog.shift(900).plot(ax=ax[1])
goog.tshift(900).plot(ax=ax[2])

# legends and annotations
local_max = pd.to_datetime('2007-11-05')
offset = pd.Timedelta(900, 'D')

ax[0].legend(['input'], loc=2)
ax[0].get_xticklabels()[2].set(weight='heavy', color='red')
ax[0].axvline(local_max, alpha=0.3, color='red')

ax[1].legend(['shift(900)'], loc=2)
ax[1].get_xticklabels()[2].set(weight='heavy', color='red')
ax[1].axvline(local_max + offset, alpha=0.3, color='red')

ax[2].legend(['tshift(900)'], loc=2)
ax[2].get_xticklabels()[1].set(weight='heavy', color='red')
ax[2].axvline(local_max + offset, alpha=0.3, color='red');
(3)移动时间窗口
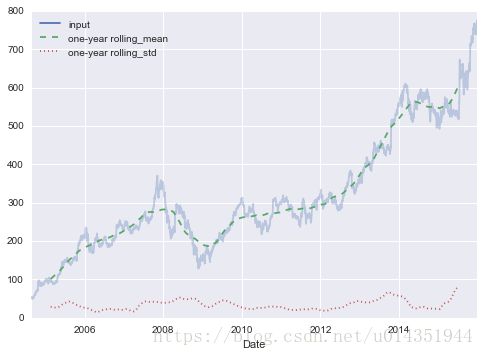
移动统计值,通过DataFrame和Series的rolling()属性实现
rolling = goog.rolling(365, center=True)

data = pd.DataFrame({'input': goog,
                     'one-year rolling_mean': rolling.mean(),
                     'one-year rolling_std': rolling.std()})
ax = data.plot(style=['-', '--', ':'])
ax.lines[0].set_alpha(0.3)
高性能pandas
eval()和query()都依赖与Numexpr,使得用户可以直接运行C语言速度的操作,eval使用字符串代数式实现高性能运算
1、pd.eval()支持的运算:
(1)算术运算符
(2)比较运算符
(3)位运算符,&和|
(4)对象属性和索引,通过obj.attr获取对象属性,通过obj[index]获取索引
pd.eval('df1 < df2 <= df3 != df4')
pd.eval('(df1 < 0.5) & (df2 < 0.5) | (df3 < df4)')
pd.eval('df2.T[0] + df3.iloc[1]')
2、DataFrame.eval()实现列间运算
新增列
df=pd.DataFrame(rng.rand(1000,3),columns=['A','B','C'])
df.eval('D=(A+B)/C',inplace=True)
df.head()
输出:
    A   B   C   D
0   0.234524    0.306290    0.328243    1.647604
1   0.051188    0.232454    0.734486    0.386178
2   0.079281    0.207351    0.169633    1.689713
3   0.855824    0.703545    0.227587    6.851752
4   0.789330    0.492029    0.045686    28.047263
通过@符号可以使用Python的局部变量
3、DataFrame.query()方法
result=df.query('A<0.5 and B<0.5')
resutt2=df[(df.A<0.5)&(df.B<0.5)]
np.allclose(result,resutt2)
输出
True
